January 5, 2023 —
QuantStreet’s Performance in December of 2022
After a very strong performance in October and November of 2022, December was a down month for us, and for global markets in general. We did better in December than the S&P 500 and NASDAQ indexes, which both had weak months, while underperforming the MSCI All Country World Index (ACWI).
In December, our portfolio consisted of exposures to momentum stocks, U.S. investment grade corporate bonds, commodities (which we discuss further below), and the S&P 500. The first three components of our portfolio did relatively well, but the S&P 500 exposure underperformed ACWI in December, largely on the back of a weaker dollar (a weaker dollar mechanically increases the dollar price of foreign stocks, which are heavily represented in the ACWI index).
Exhibit 1: Performance in December 2022 and Since Launch
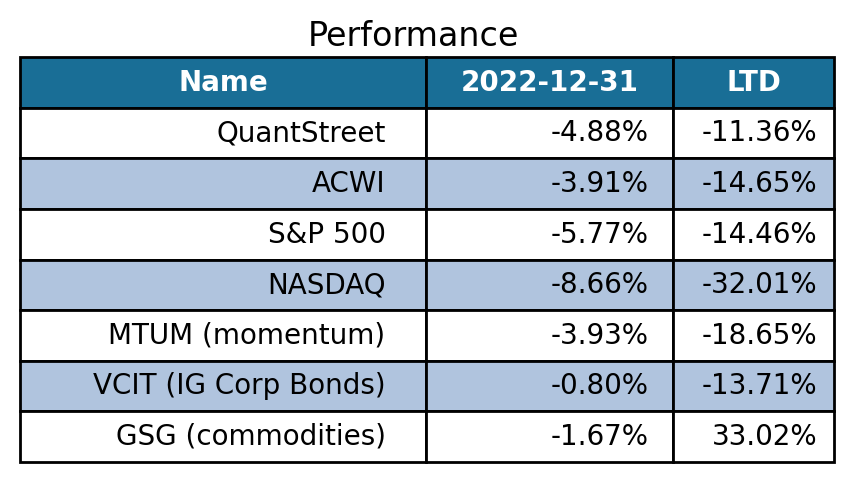
This table shows the realized, post-fee QuantStreet Core Strategy performance in December 2022, as well as since our December 2021 launch. The performance numbers for our benchmark, the MSCI All Country World Index (ACWI), and other selected asset classes, like the S&P 500, are also shown. Sources: QuantStreet, Bloomberg
Our model continues to favor a large U.S. exposure, but in January we added some foreign stocks and bonds to the portfolio as well. In a research piece from a few weeks ago, we analyzed where the U.S. stands in the global business and central bank tightening cycles relative to other major economies. Our conclusion was that the U.S. is several months, if not quarters, ahead of other countries both in the pace of the Federal Reserve’s monetary policy relative to other central banks and in the level of inflation, which has started to tail off in the U.S. more quickly than in other countries.
This suggests that U.S. corporate earnings will rebound more quickly than the earnings of other countries, and this should be reflected in U.S. stock outperformance. So despite potentially continuing dollar weakness (and some think the dollar weakness will reverse), our view is that U.S. corporate earnings will carry the day. Based on this fundamental analysis, and based on our quantitative model allocations, we maintain a U.S. overweight in our portfolio.
Positioning for the Month Ahead
QuantStreet’s portfolio allocation process is dynamic. Every month, we rerun our machine learning forecasting models to produce a return forecast for each of our asset classes. We then combine this forecast with a trend signal for each asset class, and feed all this data into our portfolio engine. The portfolio engine, which also knows about the risk and correlation levels of our asset classes, then generates the highest expected return portfolio at our targeted risk level, which for our Core strategy is the risk level of the ACWI index. As with all quant models, there is a little bit of art that goes into the process (for example, the portfolio engine has all sorts of rules about not having too much or too little exposure in certain asset classes), but that is a story for another day.
Exhibit 2: QuantStreet’s Core Portfolio Positioning as of January 2023
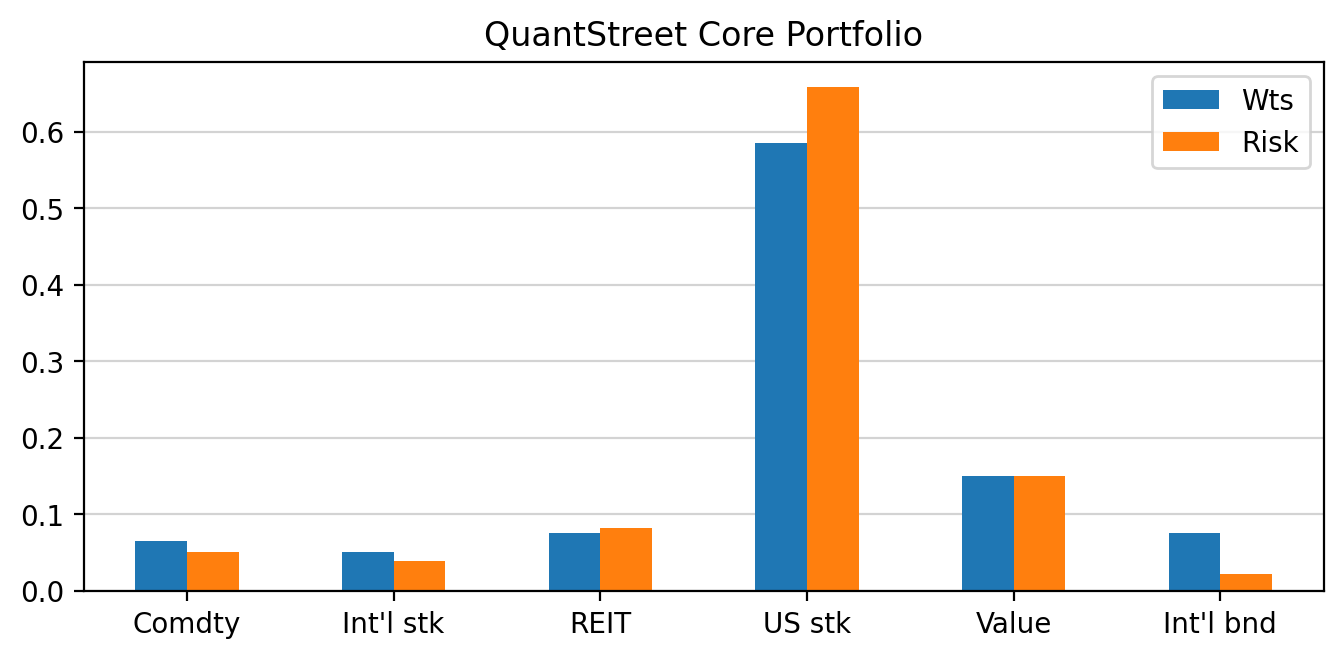
The blue bars show the percentage of QuantStreet’s core portfolio allocated to each asset class, and the yellow bars show the marginal contribution of each asset class to the volatility of the overall portfolio. Source: QuantStreet
Sometimes it happens that the new highest-expected-return portfolio for the month ahead looks quite different from the prior month’s portfolio, and this was the case in January of 2023. Our current portfolio adds exposures to U.S. value stocks and REITs, as well as to international stocks and government bonds. Momentum stocks and investment grade corporate bonds, which were in the portfolio last month, have now been kicked out. What’s nice about the current portfolio allocation is that the international exposure provides a bit of a hedge in case the U.S. dollar continues to fall against international currencies. As we already mentioned, this will have the mechanical effect of increasing the dollar price of our international positions.
The point of this is that QuantStreet, unlike asset allocators that use static portfolios, has tools that allow us to dynamically reposition our portfolios in response to changing market and economic conditions. In some months, this does not mean much for the existing portfolio, but in others it means pretty large changes. Such was the case in January of 2023.
Thoughts on our Commodity Exposure
By the way, since commodities are real assets, if the dollar weakens, the dollar price of commodities should also increase. So our commodity exposure provides a bit of a natural hedge against a weakening dollar. In fact, our commodity exposure is pretty interesting for multiple reasons (for example, how does one even get a commodity exposure in one’s portfolio?) and in this month’s letter, we dig a little deeper.
QuantStreet’s commodity exposure is implemented via a position in the GSG exchange traded fund (ETF). The GSG ETF, which is managed by BlackRock’s iShares unit (one of the largest ETF providers), has positions in U.S. Treasuries and cash, which all serve as collateral for its core position: an investment in a futures contract tracking the S&P Goldman Sachs Commodity Index (SPGSCI). According to an Investopedia article, the SPGSCI consists of a combination of energy (54%), agricultural (27%), and metals (19%) exposures.
Why do we have an exposure to this index? The first reason is that the trend component of our signal favors a commodities allocation in the portfolio because, as Exhibit 1 shows, the commodity sector remains the sole major asset class to be up year-over-year. The second reason is that commodities have very low correlations with all of our other exposures, both stocks and bonds. Thus having commodities in the portfolio provides a nice diversification benefit since this asset class marches to the beat of its own drummer.
One of our key philosophies at QuantStreet is to pay attention to the model, but also to subject all of our positions to a sanity check: Is the model missing something obvious that a human being who reads the news knows about but the model does not? (Though, news-based measures are also part of our forecasting variable set!) So, outside of model considerations, does our commodities allocation make sense?
In a world of geopolitical uncertainty and of inflationary fears, a commodity exposure provides a natural hedge against (1) the tragic conflict in Ukraine taking a turn for the worse, and (2) a sharper increase in inflation than the market currently anticipates. (Note that neither of these is our base case scenario, but hedges are supposed to protect against unforeseen contingencies which are not part of base case outcomes.)
Of course, hedges (i.e., insurance) come with costs. How high is the cost of our commodity exposure likely to be? The trend part of our model’s signal suggests that commodity prices are likely to continue to be strong in the year-ahead, so in this sense the cost is not high. To dig deeper into the fundamentals of the commodities exposure, we spent a fair bit of time analyzing the economics of oil markets (which represent over half of the SPGSCI index). You can read our lengthy discussion of this topic at Seeking Alpha, but if you are easily bored by wonkish discussion of global oil markets, here is the summary:
- Oil supply is tight.
- Oil demand has been weak. Concern about demand is driven by central bank policy tightening and weak China growth.
- But, should the anticipated global recessions prove less severe than expected and should China resume growth after its relaxation of COVID-19 restrictions, oil prices could surge meaningfully higher.
One telling chart is what happened to U.S. crude oil stockpiles in 2022 on the back of the Biden administration’s release of the Strategic Petroleum Reserve to control energy price inflation. Whatever you happen to think about the economic or political wisdom of this move, it caused a massive depletion of U.S. oil stockpiles, which the Department of Energy (DOE) has to rectify at some point. In fact, the DOE has already started buying oil. That will be a little additional demand thrown into the global mix, which is not a bad thing for oil prices.
Exhibit 3: U.S. Crude Oil Inventory in Millions of Barrels
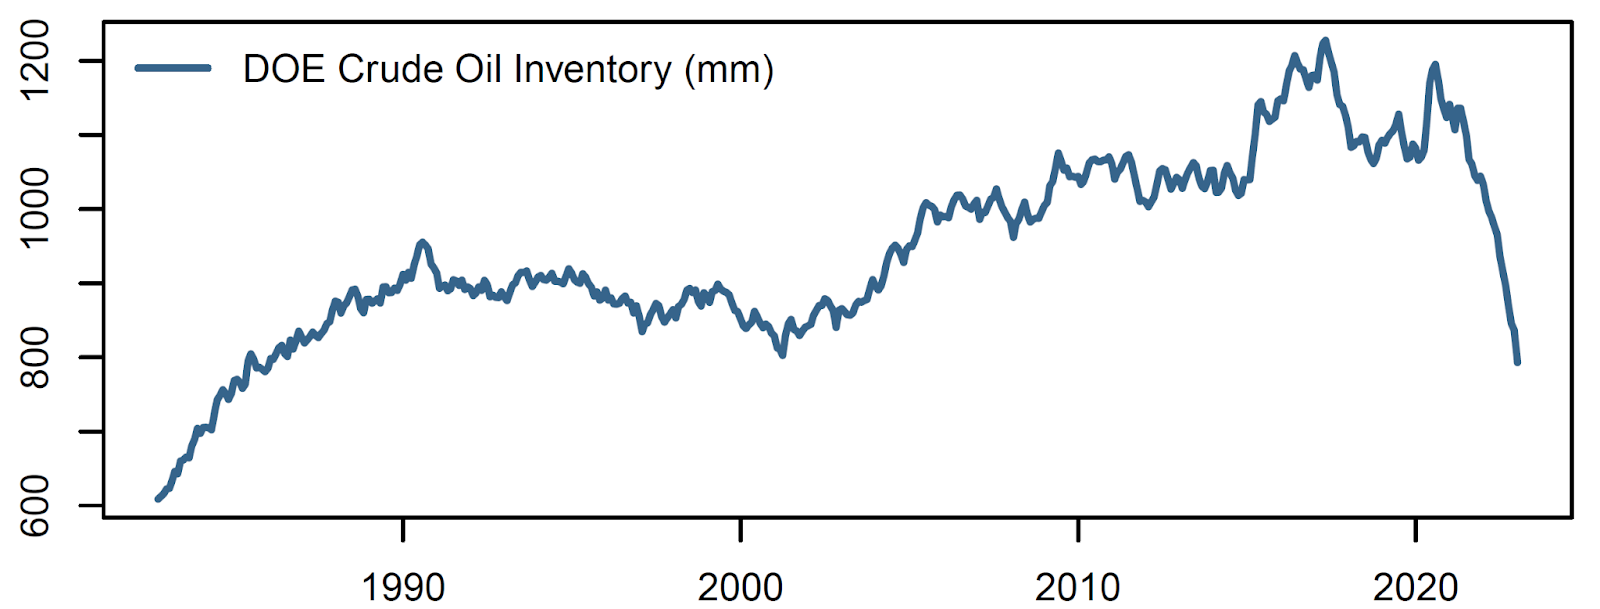
Sources: QuantStreet, Bloomberg
Based on our research, QuantStreet’s commodity exposure — model-driven as it is — passes the smell test with flying colors.