September 2, 2024 —
After a bit of an early-August swoon, the stock market came roaring back in the last few weeks of the month. The S&P 500 finished up 2.4%, though certainly in the early days of August, that did not feel like a particularly likely outcome. In client conversations a few days into the sell-off, our feeling was to stay put and not tinker with the portfolios we suggested in early August. That view came from rerunning our valuation models very close to the depths of the market sell-off and seeing that the relative positioning of all asset classes stayed roughly the same as at the start of the month. A benefit of an analytically-driven investment approach is that, sometimes, it gives you the courage to just do nothing.
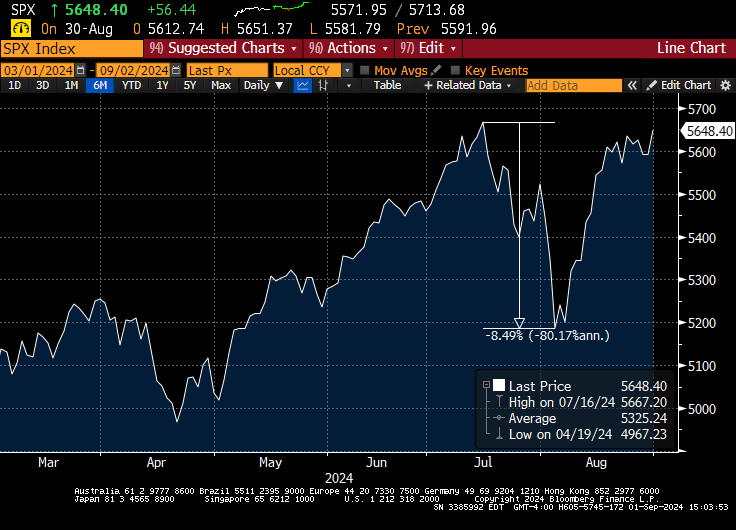
Source: Bloomberg
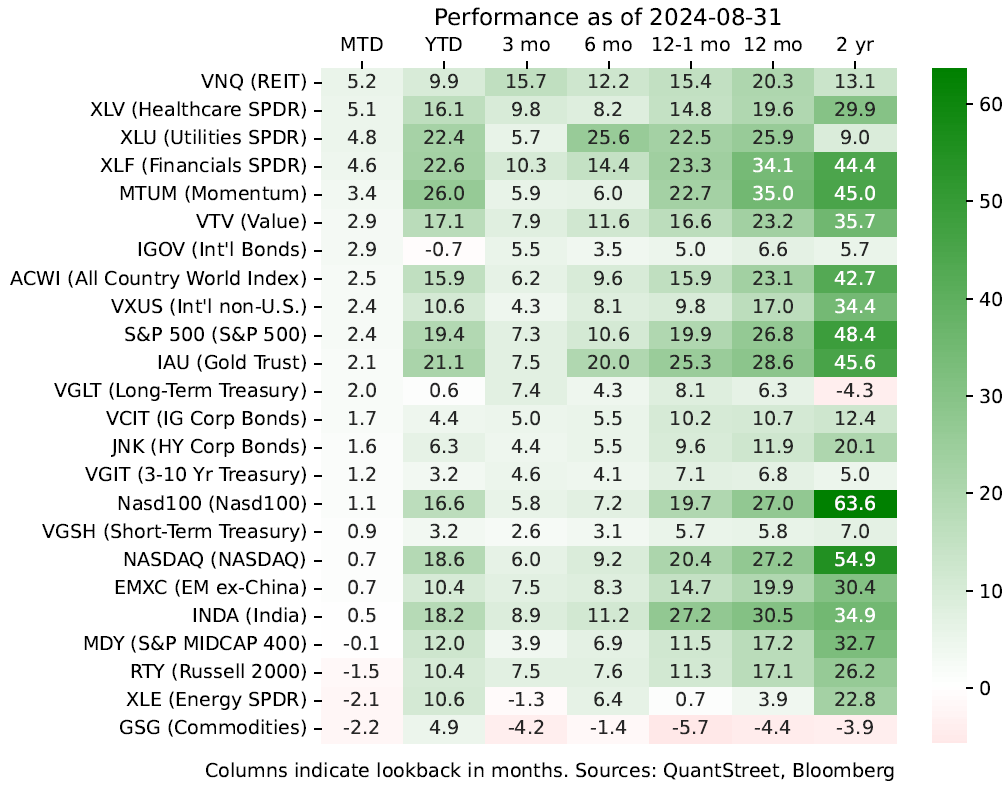
QuantStreet’s performance in August was broadly in line with our benchmarks. You can learn more about our performance here. In terms of the month’s relative winners and losers, the “value” sectors (REITs, utilities, healthcare, financials) continued to lead the way, with tech and the overall market lagging. Midcaps and small-caps had a downright awful month, though not as bad as the commodity/energy complex.
The two-chart summary of what’s been going on is that the highly aggressive Fed rate hiking cycle which started in 2022 has worked its way through the economy leading to higher (though not very high) unemployment and lower inflation. Fears of slowing growth have caused market participants to shun economically cyclical sectors (e.g., energy) and revise expectations of Fed rate cuts, now anticipated to begin with the upcoming September 18th FOMC meeting.
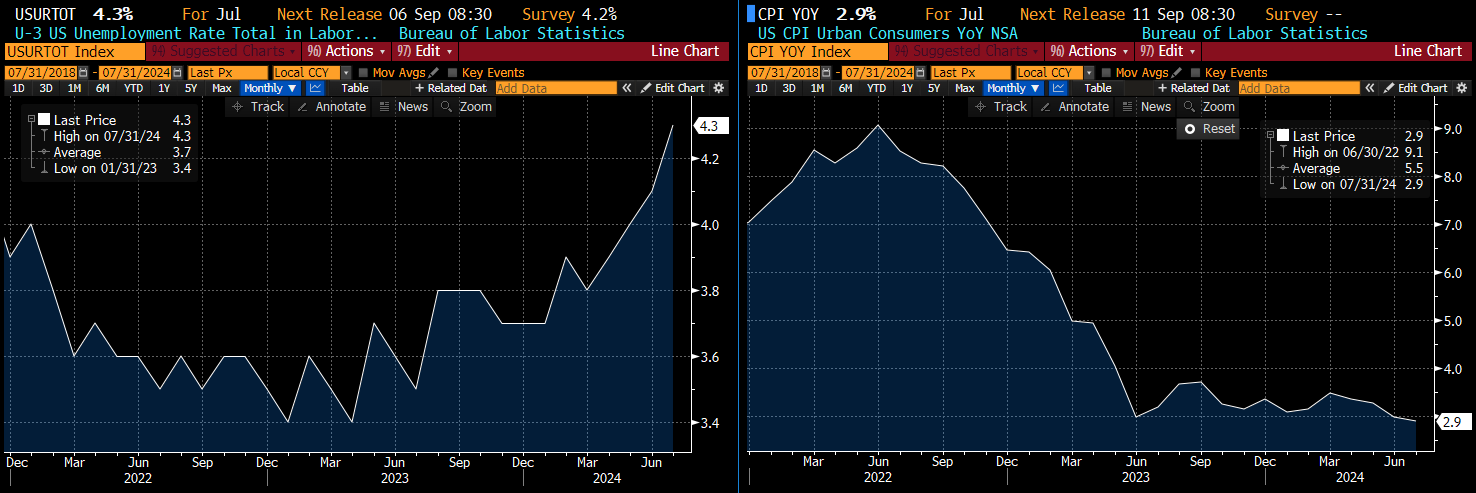
Source: Bloomberg
Macro observations
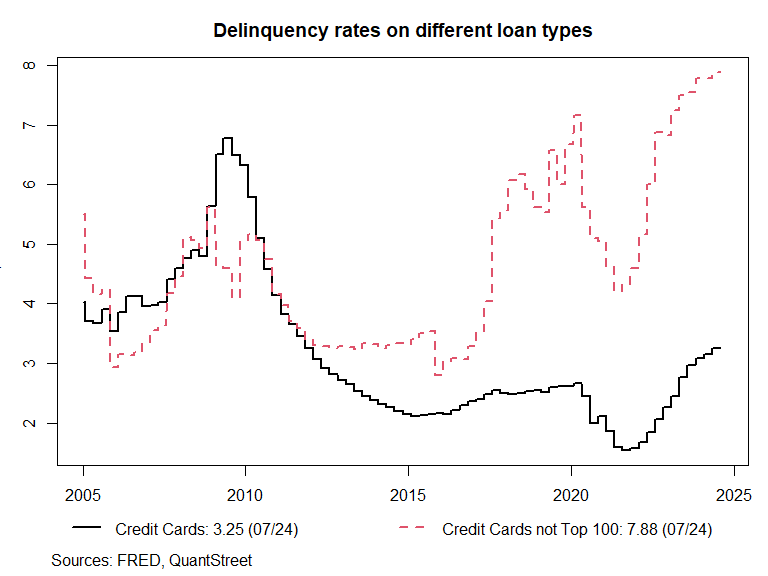
Of course, with an economic slowdown at hand, however mild it may be, the doom prognosticators are out in force. Witness a recent X (Twitter) storm about raging credit card delinquencies, despite the fact that the data are considerably more nuanced. To get the truly eye-popping numbers seen on X, one has to look at a series called “Delinquency Rate on Credit Card Loans, Banks Not Among the 100 Largest in Size by Assets” (dashed, red line below), i.e., these are delinquencies on credit cards issued by the very small banks, with their (likely) highly idiosyncratic customer bases. The more standard series is called “Delinquency Rate on Credit Card Loans, All Commercial Banks” (solid, black line). This also shows an increase, but a much smaller one, suggestive of a slowing economy but not of a deep consumer recession, as some on X would like you to believe. This brings to mind the old tenet that “[t]here are three kinds of lies: lies, damned lies, and statistics” (see this article for the quote’s origins).
Supporting the idea that we are seeing slowing, though not precipitous slowing, is the Q2 corporate earnings season. Year-over-year sales and earnings growth were both strong, a continuation of the trend seen over the prior few quarters. As the economy continues to slow — though, in our view, not at a disturbing pace — our expectation would be that earnings growth slows somewhat as well.
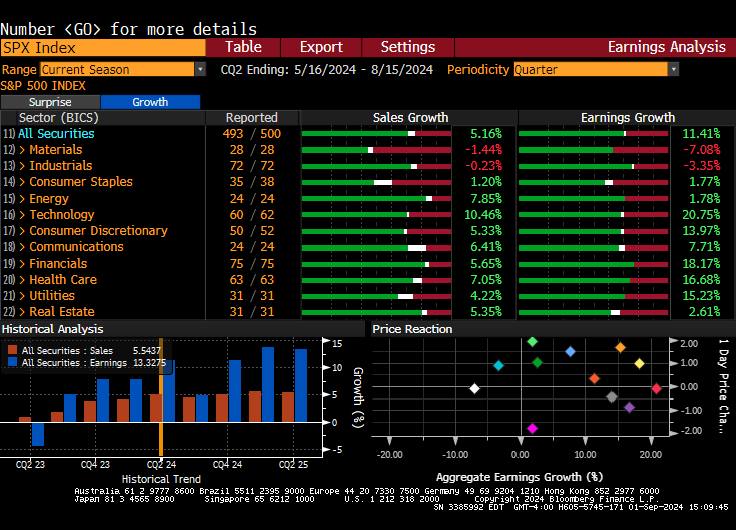
Source: Bloomberg
All eyes, of course, are squarely on the Fed. We’ve analyzed the behavior of macroeconomic and market outcomes in past Fed easing cycles (defined as at least a 1.5% rate drop over a 24-month period). The past is certainly no guarantee of the future, but at least some suggestive findings are below.
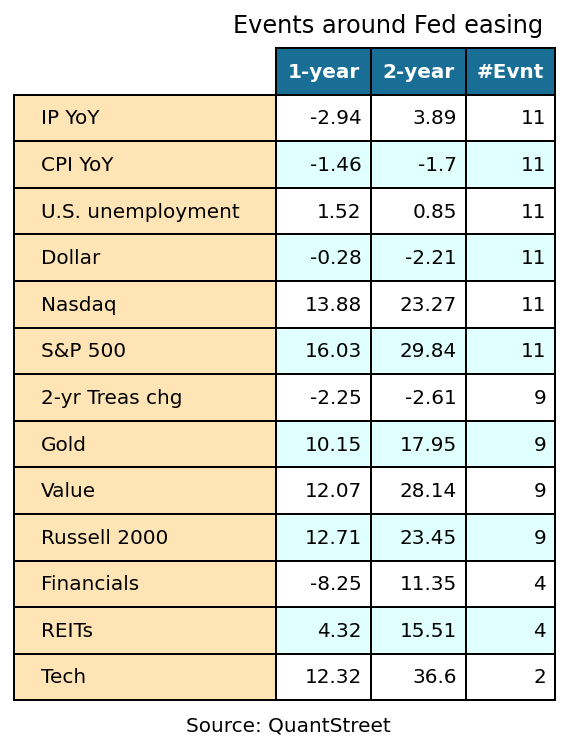
During Fed easing cycles:
- The economy slows (industrial production down, CPI lower, unemployment higher) in the one-year period post the start of Fed easing, though IP and unemployment recover (at least partially) by year two.
- In the first two years of easing, rates fall, on average by around 2.5% for the 2-year Treasury, which is negative for the dollar, though the total dollar impact (of -2.2% relative to other currencies) over a two-year period is quite minimal.
- Nasdaq and small caps (Russell 2000) both tend to do well, but value stocks do even better (around 5% outperformance relative to Nasdaq and small caps by year two).
- But the biggest stock winner appears to be the S&P 500 index, with a two-year gain of close to 30% on 11 observed easing episodes. As we’ve written in the past, Fed easing is typically associated with slowing earnings growth but increased valuation multiples. And the latter effect dominates.
- Gold does well (we’ve also discussed this in the past) with two-year cumulative return of 17.95% on average.
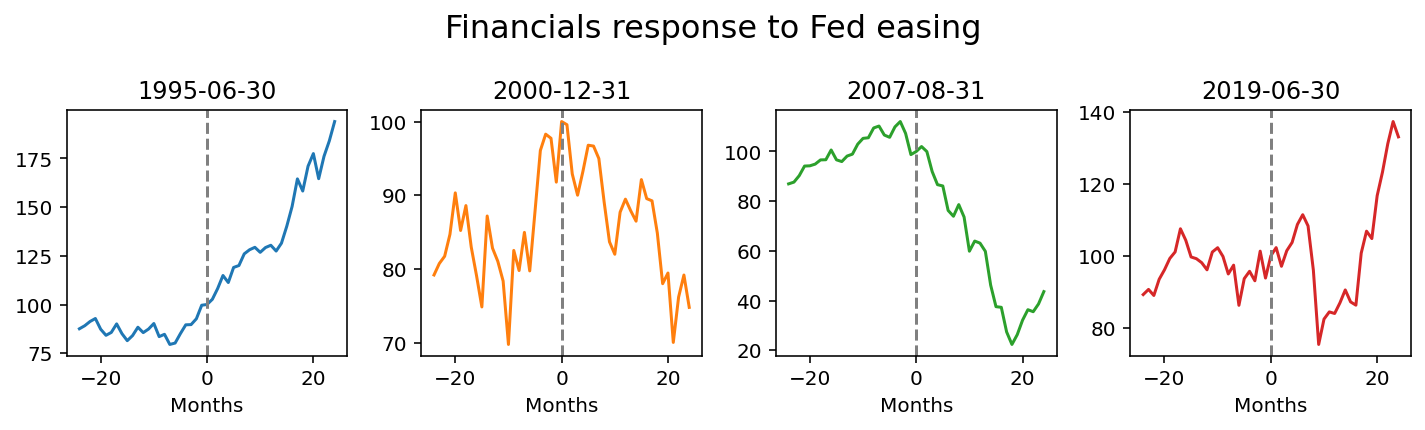
- For financials, REITs, and the S&P technology subsector, we don’t have enough stock price data to say much. For example, for financials, there are only 4 cases of Fed easing in our sample. The sector did well in the 1995 and 2019 episodes, but did poorly in 2000 and 2007. The latter may not be representative since that easing episode is associated with the global financial crisis. In these four episodes, financials were down 8.25% on average in year one but up on average 11.35% cumulatively after year two. But with so few observations, it is hard to generalize.
Sources: QuantStreet, Bloomberg
The takeaway from these event studies is that, if the Fed eases in September and if things stay true to historical form, the economy is likely to slow over the next one to two years, but financial markets are likely to do well, which includes small caps, Nasdaq, and value stocks. But the best historical performer has been the S&P 500 itself.
Portfolio changes
As we’ve been doing for the last several months, we reduced our Nasdaq position. We continually refine our forecasting models, and a recent modification — where we introduced operating margins and their year-over-year changes as new forecasting variables — both improved our model’s forecasting power for the Nasdaq index and also made the forward-looking return less attractive. The problem is that year-over-year operating margins are way up for Nasdaq, and historically that has not been a good sign for future returns (perhaps because sectors with high year-over-year changes in operating margins become overpriced). Our overall signal, a combination of trend and machine learning model forecast, still makes Nasdaq look reasonably attractive, but less so than before. Thus we reduced our position.
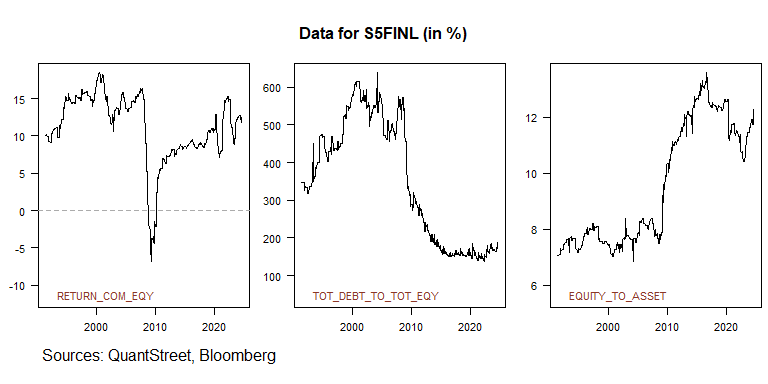
We initiated a small position in the financials sector, based largely on the asset class trend, as our valuation model does not like the sector’s high price-to-book ratio. However, the net effect of our combined trend and model signal is favorable for the sector. Taking a look at the sector’s fundamentals, we see that return on equity has been steadily increasing in the years since the global financial crisis, the total debt to total equity ratio has fallen, and the capitalization (book equity to book asset) ratio has increased from 8% to 12%. With the sector’s fundamentals in good shape (despite potential overhang from commercial real estate exposure), the diversification benefit of adding the sector to the portfolio (financials have relatively low correlations with the S&P 500 and Nasdaq) and our model’s attractive hybrid signal justify the addition of financials across our different risk-targeted portfolios.
In addition, the financial sector contains many balance-sheet-light firms which are more focused on data and technology than making loans, like Visa, Mastercard, S&P Global, and of course, in a class by itself, Berkshire Hathaway. Finally, among all correlations we track, financials are most correlated with value stocks, which tend to do well during Fed easing episodes, providing a bit of a catalyst to the position.
If any of this triggers thoughts or questions, please reach out. We’d love to hear from you.
Working with QuantStreet
QuantStreet offers wealth planning, separately managed accounts, model portfolios and portfolio analytics, as well as consulting services to our clients. Our approach is systematic and data-driven, but also shaped by years of investing experience. If you are an existing client or if you are thinking about working with us, we’d love to hear from you. Please reach out to us at hello@quantstreetcapital.com.
Cover picture generated by Gemini.