November 15, 2022 —
With Tuesday’s (Nov 15th) Producer Price Index (PPI) numbers bringing more relief on the inflation side, a new bearish narrative has been put forward by financial pundits over the last few days. The new story goes like this:
“While we now acknowledge that the Fed has put in place enough tightening to bring inflation under control [PS: they did not acknowledge this last week], we now gravely caution investors that the Fed will bring about a recession which will be accompanied by poor corporate earnings, and this will be the new catalyst to bring stocks down to levels at which buying them will be a great investment. So sit on the sidelines and wait it out.”
Fair enough, and certainly inventive. But let’s look at the data.
First, if we count as recessions episodes of trough year-over-year (YoY) growth in industrial production (IP), then there have been 11 such events since the start of our S&P 500 earnings data. In those 11 recessionary episodes, last 12-month S&P 500 earnings per share did indeed fall (by about 10%) after the onset of the recession. See Figure 1.
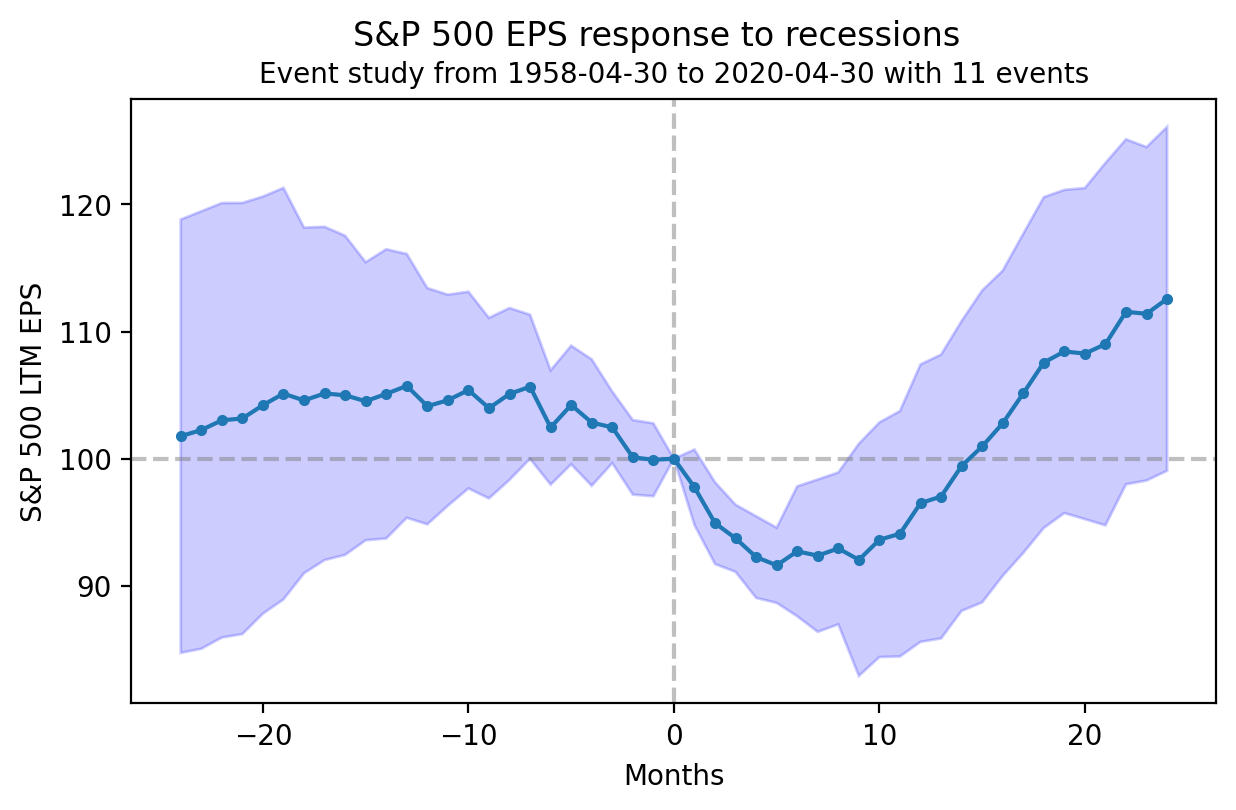
Figure 1: Event study of average S&P 500 earnings per share (EPS) around troughs in YoY IP growth. The EPS number has been normalized to 100 on the month of trough YoY IP. The blue region indicates 95% confidence bands around the event study. Source: QuantStreet Capital
Second, it is also true that after the onset of these 11 recessions, the stock market had, on average, a massive rally in the subsequent 24 months (after having fallen in the year or so prior to the trough in economic growth). See Figure 2.

Figure 2: Event study of average S&P 500 total returns around troughs in YoY IP growth. The total return number has been normalized to 100 on the month of trough YoY IP. The blue region indicates 95% confidence bands around the event study. Source: QuantStreet Capital
How can this be? Well, markets are forward-looking. Once the recession sets in, investors begin to anticipate an earnings rebound, and multiples expand. Figure 3 shows that the S&P 500 price to earnings ratio (P/E), on average, experiences an expansion in the year or so after trough IP growth, and then begins to come down as earnings growth starts to kick in. The net result: the large S&P 500 rally seen in Figure 2.
It pays to remember that, while listening to bearish pundits is certainly entertaining, it is not always remunerative.
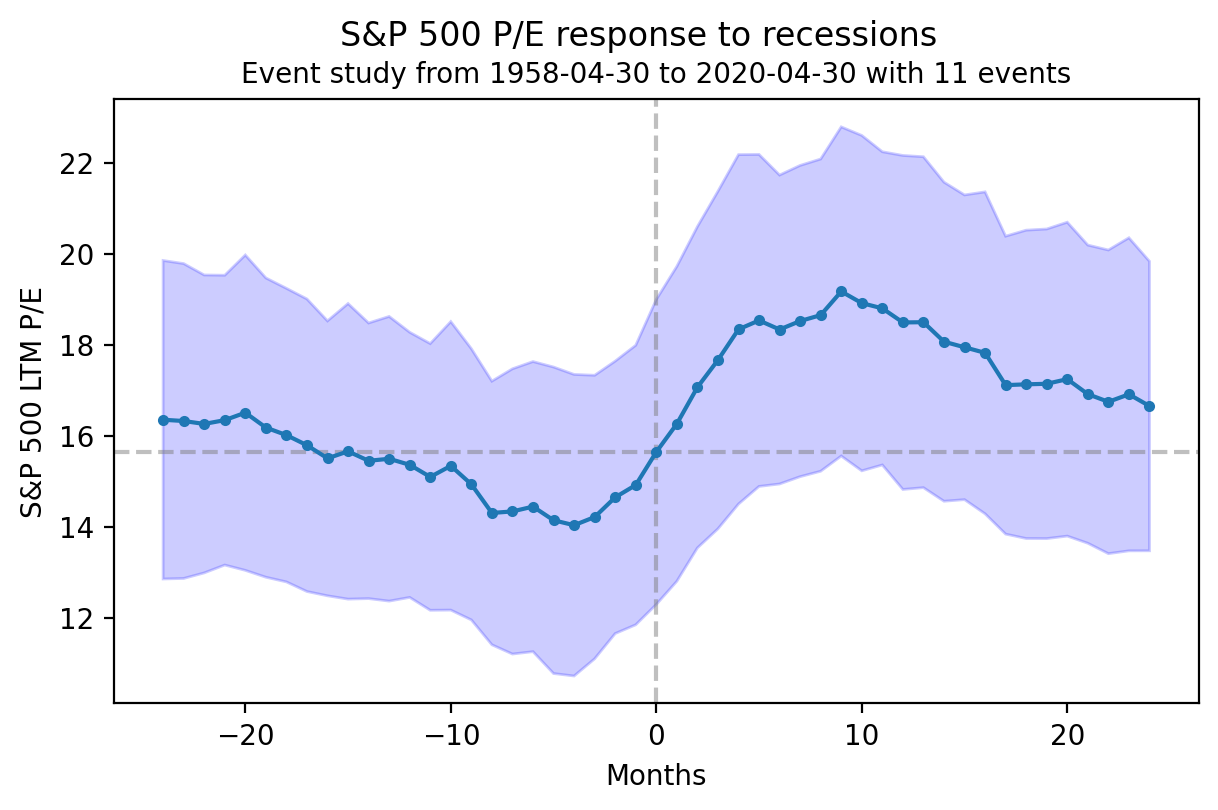
Figure 3: Event study of average S&P 500 price to last twelve-month earnings ratios (P/E) around troughs in YoY IP growth. The blue region indicates 95% confidence bands around the event study. Source: QuantStreet Capital