December 5, 2022 —
Year in Review
The end of November 2022 marks one year since our launch [1], so we decided to get in front of the crowd by one month and share our year-end retrospective in early December. The year began with the economy and financial markets still in a euphoric, post Covid-19 recovery phase. The major tensions that would come to dominate 2022 — Ukraine, inflation, recession — were not yet front of mind for investors. What was taking up mindspace: crypto currencies and non-fungible tokens. Super Bowl 56 (which took place just two weeks before Russia’s invasion of Ukraine) featured the exquisitely ironic Larry David FTX commercial [2], which appeared a mere nine months before FTX filed for bankruptcy.
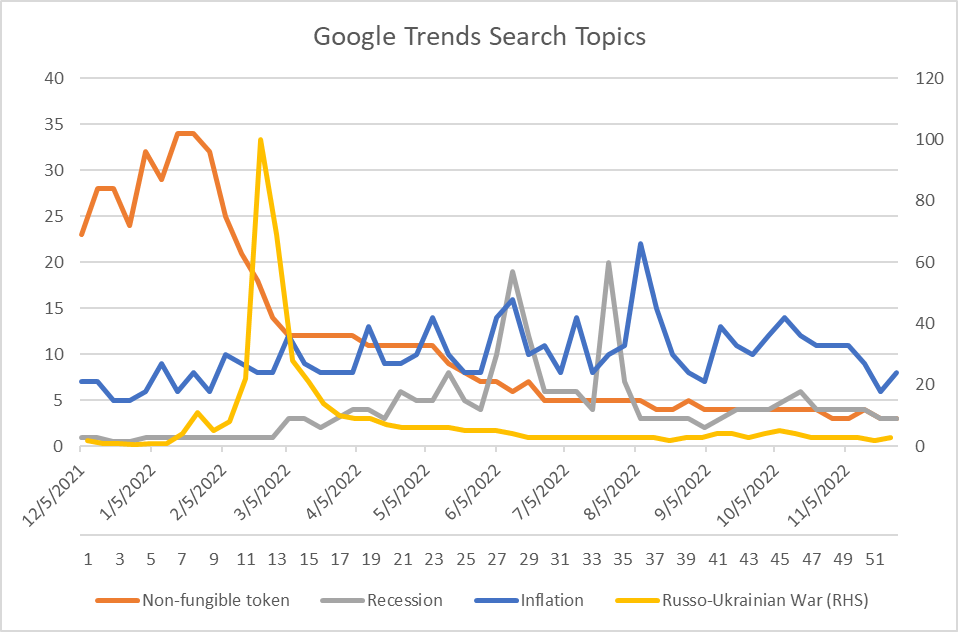
This figure shows the relative frequency of Google searches for four topics: Recession, Non-fungible tokens, Inflation, and the Ukraine war (whose search frequency is shown on the right axis). Source: QuantStreet, Google
Alas, the blithe state of markets in December of 2021 and January of 2022 was destined to be short-lived. The most traumatic episode of the year took place on February 24 when Russia, to the astonishment and dismay of most of the rest of the world, invaded Ukraine. What had up until then been a narrative of temporary inflation in the U.S. — a rise in goods prices due to temporary supply chain bottlenecks in the wake of the Covid-19 pandemic — turned into full-blown inflation angst as energy and commodity prices spiked, which in turn made central bank monetary policy front and center in investor portfolio considerations. Bonds and stocks sold off in unison, as the long-vaunted negative stock-bond correlation failed to cushion the blow of this perfect inflationary storm.
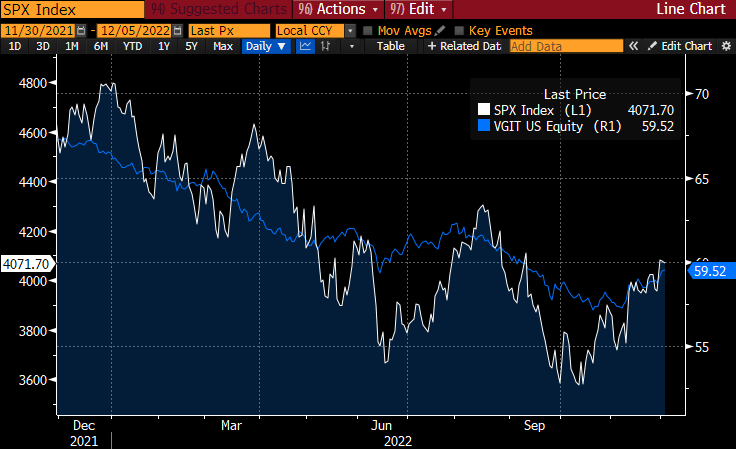
As inflation fears have recently subsided — on the back of enormous Federal Reserve policy tightening and some nascent signs of easing price pressures — a new narrative has entered into the investor lexicon: fears of an earnings recession driven by globally tight central bank monetary policy. The above chart, which shows Google search intensities for four major 2022 themes (crypto, Ukraine, inflation, recession) neatly summarizes the shifting investor focus over the course of the last twelve months. The chart below, which tracks the performance of the S&P 500 index and of U.S. government bonds (in blue) from December 2021 until now, shows how these different cross-currents factored into the performance of major stock and bond asset classes.
Source: Bloomberg
With so many cross-currents to navigate, 2022 brought into sharp focus the benefit of QuantStreet’s rigorous, analytics-driven approach to asset allocation. Every month, we re-estimate our return forecasting models for our investable asset classes (14 at last count). These models use machine learning techniques to whittle down a large collection of forecasting variables to a parsimonious set of forecasters for each asset class. We then determine our risk target — for our Core strategy, the last twelve-month volatility level of the MSCI All Country World Index (ACWI) — and find the highest expected return portfolio at that risk target.
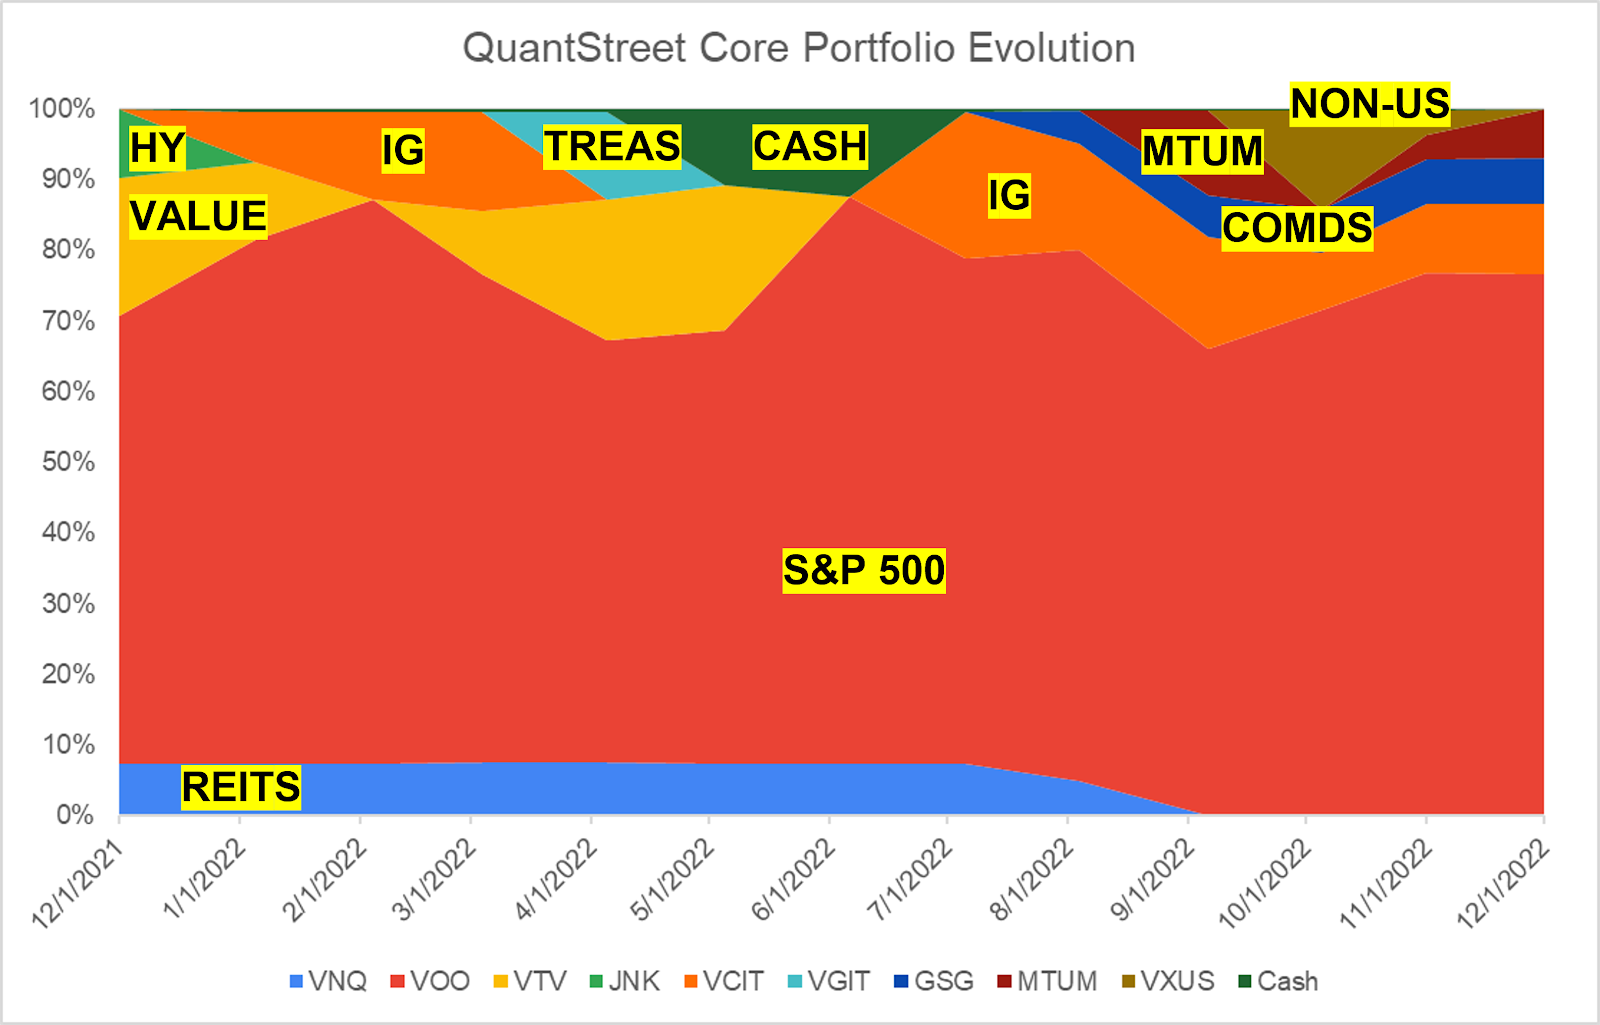
The figure below shows how our Core strategy portfolio evolved from our December 2021 launch until now. We launched with investments in high-yield (HY) bonds, value stocks (stocks that look attractively priced based on measures like the price/earnings ratio), the S&P 500, and real estate investment trusts (REITS). That initial portfolio outperformed our ACWI benchmark in December 2021, which was a good month for risk assets. The portfolio then moved into investment grade (IG) bonds, while retaining its REITS and value exposures. Towards the middle of the year, we became more defensive by moving into Treasury bonds and then into a pure cash position for part of the portfolio. This defensive stance served us well in June as we were down, but by much less than our benchmark. We then transitioned into a more aggressive posture by converting the cash position to a stake in IG bonds, then added a commodities and momentum (stocks that have been strong performers over the prior year or so) exposure, as well as a position in non-U.S. stocks, which did well over the time period that we held them.
This chart shows the composition of the QuantStreet Core portfolio as of the start of every month from our launch (December 1, 2021) until now. Source: QuantStreet
Life-to-Date Performance and Looking Ahead
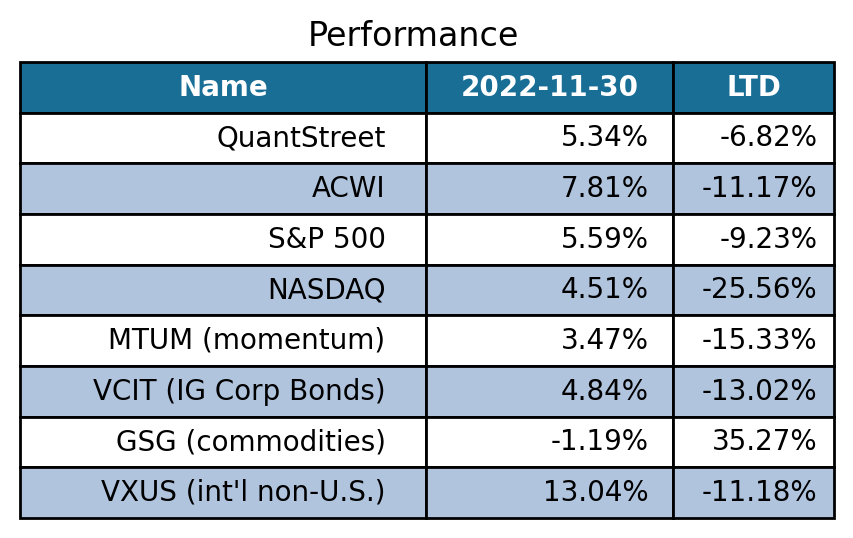
As the portfolio composition chart shows, our analytics- and data-driven approach delivers a highly dynamic asset-allocation strategy, which aims to optimally (in a forward looking sense) use the allocated risk budget to invest in asset classes that are forecasted to be the best future performers. How well have we done since our December 2021 launch? The table below shows the actual performance of the QuantStreet Core strategy in November 2022 and since our launch. Our Core strategy had a good month in November, which followed an even better performance in October. Since launch, our Core strategy is down 6.8% after fees, which is almost 4.5% better than our ACWI benchmark. While we do not target the S&P 500 (our Core strategy takes less risk), we have also outperformed this major U.S. benchmark since launch.
This table shows the realized, after-fee QuantStreet Core strategy performance in November 2022, as well as since ourDecember 2021 launch. The performance of our benchmark, the MSCI All Country World Index (ACWI), and other selected asset classes is also shown. Source: QuantStreet, Bloomberg
With regard to our current positioning, we remain fully invested at a risk target that is slightly higher than our ACWI benchmark. As the above composition chart shows, our portfolio is now allocated across S&P 500, commodities, investment grade bonds, and momentum stocks. As we have written in the past, there are still many uncertainties out there, but we feel that the earnings recession narrative is overdone, and that the hopeful inflation signs we’ve seen over the last few months are likely to persist into 2023. We will continue to diligently use our analytically-driven risk and allocation approach to monitor new economic and market developments as they occur, and to dynamically reposition our clients’ portfolios as new developments warrant.
QuantStreet’s Saving/Investing Simulation Tool: A Preview
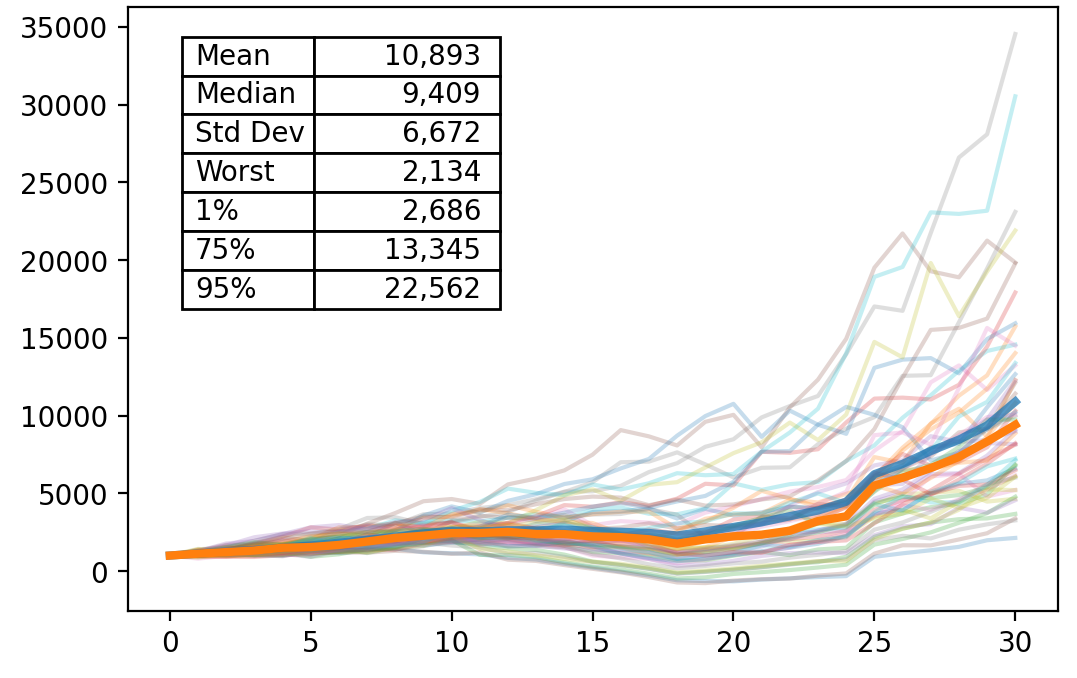
We have been hard at work over the last month building a simulation tool to help investors project their anticipated income and expenses, and to better understand how these interact with their investment allocations. One key insight our tool provides is that it is not sufficient to look at average anticipated stock and bond returns when thinking about portfolio allocations. Investors need to look at the range of possible outcomes, both good and less-good, and be satisfied that the less-good outcomes are in line with their financial objectives. The figure below shows an example of the simulated path of future wealth that our model produces for a sample client profile. You’ll hear more about this tool in the months ahead. In the meantime, if this kind of financial planning analysis is of interest, please don’t hesitate to be in touch. We can walk you through it.
The blue and yellow lines show the average and median client wealth across portfolio simulations. The lighter lines show simulated outcomes. The x-axis shows the investor horizon in years from today. Source: QuantStreet
Endnotes
[1] We started counting as of day-end November 30, 2021. So our first daily return is December 1, 2022.
[2] The Larry David FTX commercial: https://www.youtube.com/watch?v=hWMnbJJpeZc