July 5, 2022 —
Reflections on June
Seemingly every bad economic narrative reared its ugly head in June, as markets swooned on the back of fears about inflation, slowing economic growth, an either complacent or overly aggressive Fed (depending on who is doing the prognosticating), a continuing meltdown in crypto and its hyper-levered defi ecosystem, and an unwinding of the great globalization trend that’s taken place over the last several decades. Regardless of what you think about the merits of any one particular argument, you must admit this is a long list of worries.

June performance. Source: QuantStreet, Bloomberg
Then again, looking at market performance in June (ACWI, S&P 500, Nasdaq, REITs, etc.) it would have been shocking if the news flow was not absolutely awful (and, of course, it was). Like markets overall, QuantStreet was down in June, but we continued to outperform our benchmark, the MSCI All Country World Index (ACWI). In fact, our outperformance relative to ACWI since QuantStreet’s December launch now stands at +4%, on a post-fee basis (i.e., after fees have been deducted from our portfolio’s return).
QuantStreet does not run a market-neutral strategy, which is hedge-fund-speak for saying that a particular strategy’s return doesn’t depend on what overall markets are doing (as an aside, most “market-neutral” hedge funds aren’t really market neutral either, but that’s a topic for another day). Simply put, QuantStreet’s strategy follows the markets. When markets are up, we’ll generally be up; when markets are down, we’ll generally be down. Since launch, we’ve outperformed our benchmark while taking on a similar amount of risk. By that metric, we did well in June, though that does not take the sting out of a bad month for the markets more generally.
Green Shoots
Back in the days of the global financial crisis of 2008-2009, people started talking about “green shoots,” which meant things were still awful but there were glimmers of hope in some far-off corners of the economy and of financial markets. Where to see glimmers of hope now? Consider five-year breakevens. This is the difference between the yield on five-year Treasury bonds and the yield on five-year TIPS (Treasury Inflation-Protected Securities), which are Treasury bonds whose principal is protected against loss in value due to inflation. The difference between these two yields is called the inflation breakeven. You can think of this as the market’s expectation of what the inflation rate will look like in the next five years.[1] As the next chart shows, the market’s expectation about inflation in the next five years just took a big plunge in the last few months, from close to 4% in March to just above 2.5% now. Market participants are starting to think that the Fed will, after all, be able to contain inflation.
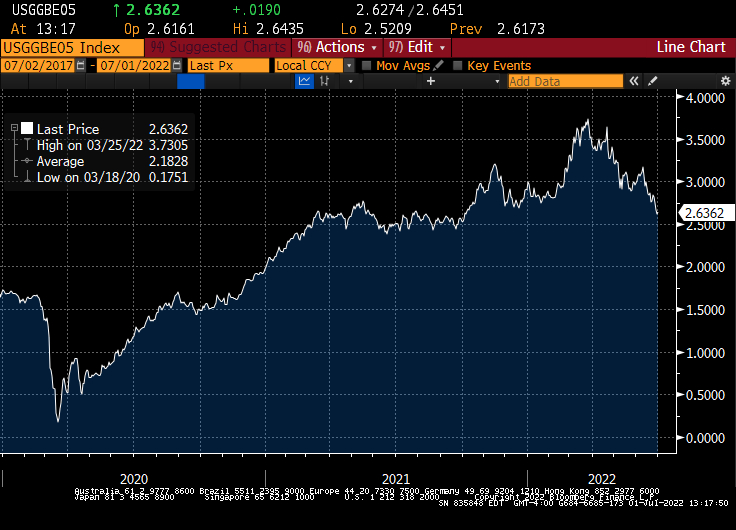
Five-year breakeven. Source: Bloomberg
Another green shoot can be found in the next chart, which shows the performance of the S&P Goldman Sachs commodity index. One of the contributing factors to the large 2022 spike in inflation has been an extreme rise in commodity prices. The S&P GSCI contains agricultural, metals, and energy components, and so tracks the overall price level of a broad basket of commodities. This broad index of commodity prices peaked in early June, and has declined (slightly) since then. Given the role that increased commodity prices have played in the present inflationary episode, seeing even a slight letup in commodity price rises counts as good news.
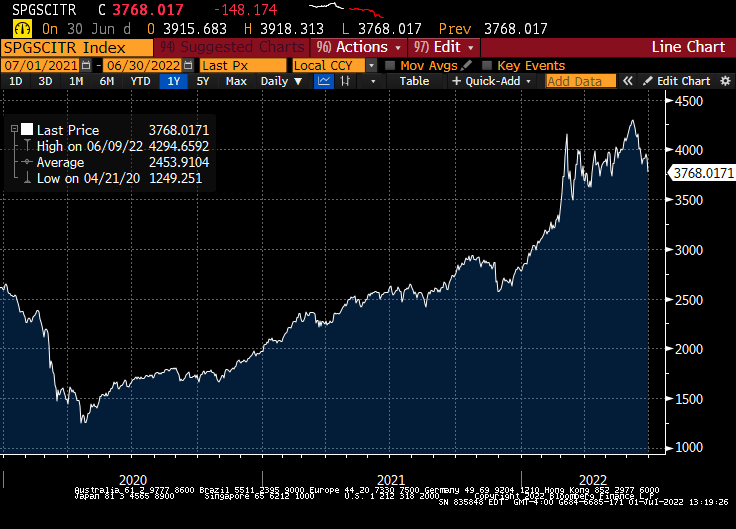
Commodity prices. Source: Bloomberg
So what gives? First, high commodity prices tend to be self-correcting, at least to an extent. When oil prices soar, oil wells that were shuttered get reopened, and while that process takes some time, once new production comes online, prices begin to relent. Perhaps we are seeing the early fruits of this dynamic in the commodity space. Second, the Fed and central banks around the world have effected an enormous amount of tightening in financial conditions already. While the Fed funds rate has only increased by 1.5%, the Fed’s communication about future policy intent (among other factors) has led to: sharp drops in corporate bond prices (more on this momentarily); large increases in consumer-facing interest rates (witness the almost unfathomable rise in 30-year mortgage rates in the chart below) which is starting to cool (more like freeze) housing markets in the U.S.; and a general tightening in financial conditions. All of these will have the effect of slowing economic growth and cooling inflationary pressures.
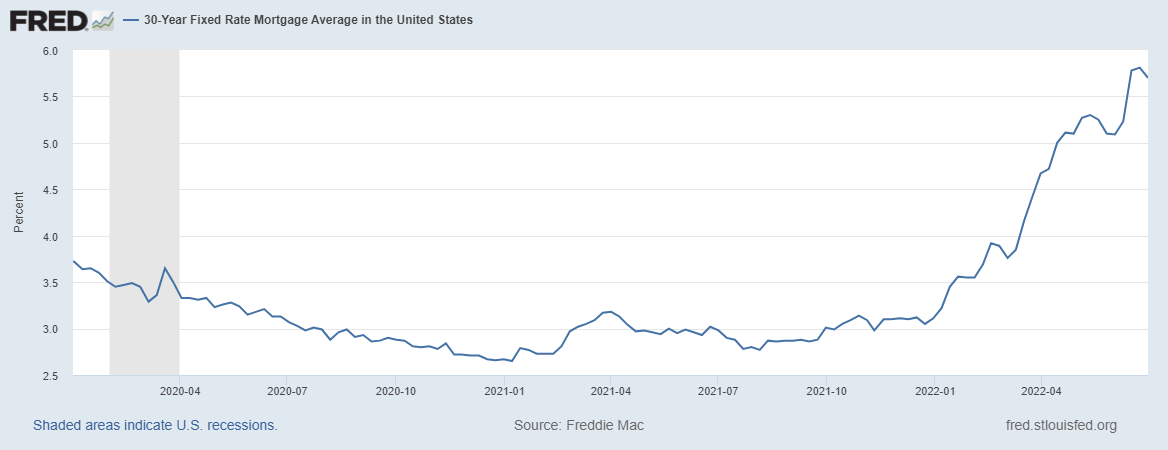
30-year Mortgage Rates. Source: FRED
Market turning points are not announced with loud fanfare. They just sort of happen while no one is looking. Perhaps we are now seeing such a turning point with respect to the inflation narrative.
QuantStreet
This all brings us back to how we are investing your money. Our portfolio has been partly in cash for the last several months, largely because bonds, while attractive on our valuation model, have had such poor performance over the last year, that our combined valuation-trend signals have kept the portfolio partly in cash. What changed this month is that bond performance has begun to stabilize (the VGIT Treasury ETF fell less than one percent in June compared to a fall of over 8% in the S&P 500 index) and, relative to other asset classes, bonds now look less bad than they did at the end of May. This is combined with our valuation model’s return forecast for investment grade bonds now being at its highest point since the depths of the 2008-2009 global financial crisis.[2] Given the tentative green shoots already discussed, the relatively less bad trend of bond performance relative to that of other asset classes, and our valuation model screaming that bonds are now a buy, we slightly reduced our S&P 500 exposure (which also locked in some realized losses for our investors, which is good from a tax point of view), and moved that and our cash holdings into a position in investment grade corporate bonds in Friday’s rebalance.
We are currently targeting a slightly lower risk level than the ACWI, which means our portfolio remains a tad defensive relative to our benchmark, but we now believe the time to deploy our cash cushion has come.
Footnotes
[1] This is not quite right, because breakevens also contain a risk premium for bearing inflation and illiquidity risk. But to a first order approximation, you can think of breakevens as being the market’s expectation about future inflation.
[2] The annualized yield of investment grade corporate bonds increased from 2% in 2021 to around 5% now, without a commensurate increase in default risk. This yield is an important component of our investment grade return forecasting model.