November 1, 2022 —
Overview
Market negativity reached a crescendo sometime around the middle of October, as interwoven narratives of doom and gloom occupied investor and media attention. The end of globalization. Out-of-control inflation. The U.K. teetering on the edge of political abyss. Hawkish central banks. Energy shortages.
The chart below, which shows the San Francisco Fed’s news sentiment index (blue line) and the S&P 500, clearly demonstrates how media sentiment has been extremely negative of late. Furthermore, media sentiment has been lagging market price action, suggesting that much of the negative news coverage just reflects events that markets have already anticipated.
This is not to say that negative news coverage doesn’t impact investor outlooks — it certainly does. And as Shiller suggests in his book Narrative Economics, this is a big part of the story.
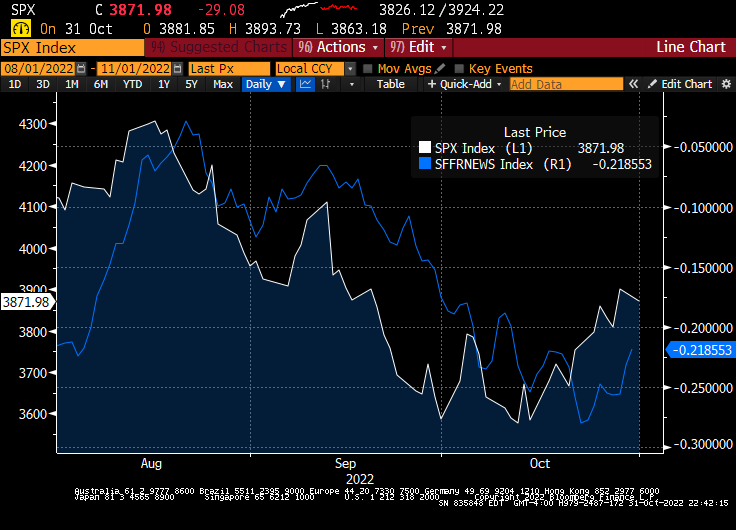
The blue line shows the San Francisco Fed’s News Sentiment indicator, which reflects the tone of economics coverage from 16 major U.S. newspapers. The lower the level, the worse the news coverage. Source: Bloomberg
On the morning of Thursday, October 13th, the bad inflation narrative reared its ugly head, as the month-over-month core Consumer Price Index (CPI) came in at 0.6%, above the expected 0.4%. On cue, financial markets nosedived in premarket trading.
And then a funny thing happened. Markets began to steadily climb throughout the Thursday trading session, and finished the day higher than the Wednesday close, up around 5% from the Thursday morning lows. What does it mean when markets rally on bad news? They must have been anticipating even worse news: as of the morning of Thursday October 13th, a lot of negativity was already baked into prices.
The Q3 2022 earnings season kicked off the next day, with JP Morgan, Wells Fargo, Morgan Stanley, and Citigroup all reporting earnings on the morning of Friday, October 14th. And then another funny thing happened. Despite what one may have read in the financial prognostication section of one’s favorite newspaper, earnings weren’t that bad. They were not great, but nor were they disastrous.
According to Wells Fargo CEO Charlie Scharf: “Both consumer and business customers remain in a strong financial condition, and we continue to see historically low delinquencies and high payment rates across our portfolios.”[1]
In the face of extreme negativity in sentiment, bank stocks managed to rally for the rest of October on the back of these not-so-awful earnings, as the next chart shows.
All prices normalized to 100 on 10/13/2022. Source: Bloomberg
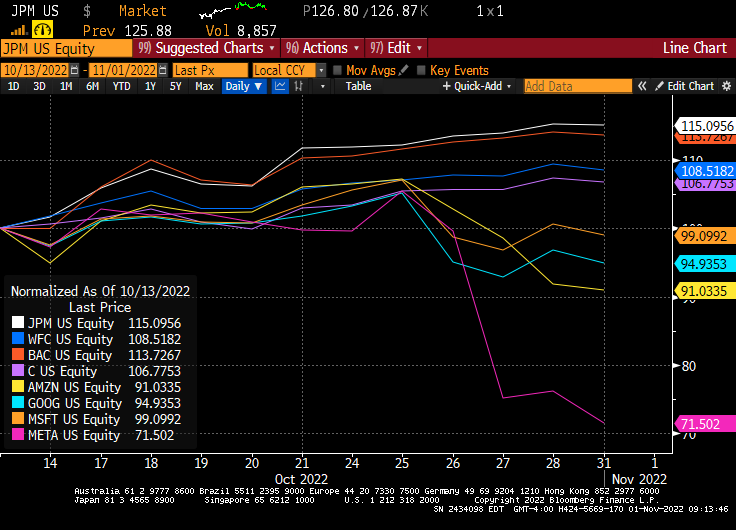
As you’ve probably read, the tech big four (Amazon, Google, Microsoft, Meta) had pretty lousy earnings, as some of the post-pandemic work/shop/play-from-home trends are starting to reverse. In fact, since the start of earnings season, these four tech stocks are meaningfully underperforming their big bank peers (see above chart).
But earnings in other parts of the economy have been fine. Even technology, in aggregate, is beating both sales and earnings expectations. Particular standouts on the earnings front are energy and utilities, which have benefited from the 2022 spike in energy prices. The figure below neatly summarizes these earnings season trends, with over half of the S&P 500 having reported thus far.
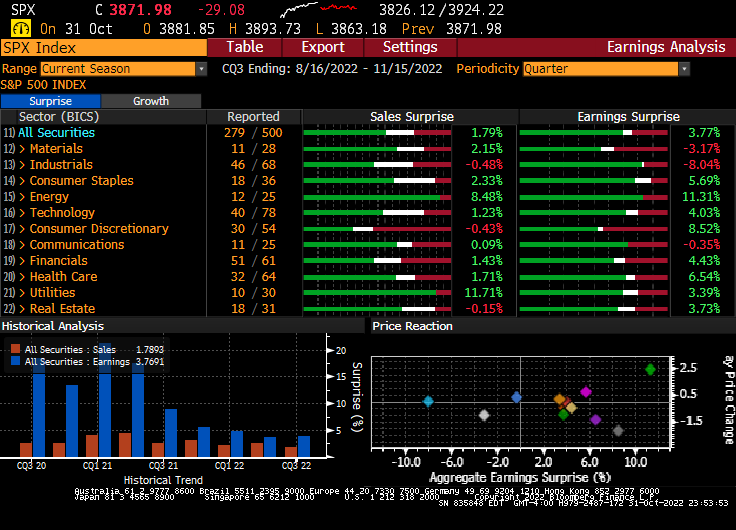
The top panel shows sales and earnings surprises. The green bars show the percent of companies in each sector that exceed either sales or earnings expectations. The white bars show the number of in-line firms, and the red lines show the number of misses. The percentages next to each bar show the aggregate dollar sales or earnings surprise in each sector. Source: Bloomberg
Finance professors never tire of telling their students that stock prices are determined by two factors: the discount rates that investors apply to future cash flows, and investor expectations of what these future cash flows will look like. Short-term market-wide fluctuations are typically driven by investors demanding either higher (when prices fall) or lower (when prices rise) expected returns from owning stocks. But in the long-run, earnings dominate. When investor cash flow expectations get sufficiently low, even a not-so-bad earnings season is enough of a catalyst to move stock prices up. And that appears to be happening this time around
Before we are accused of being pollyannaish, we readily admit that there are many negatives out there. Inflation remains an issue, despite the fact that a great deal of central bank tightening is already in the market (recall that 30-year mortgage rates are now at or above 7%, up from 3% at this time last year). The dollar has been extremely strong, which both dampens the dollar value of foreign earnings of U.S. corporations, and also causes debt fragility among sovereign borrowers with excessive dollar-denominated debt. The tragic war in Ukraine continues to be an almost incalculable tail risk, as nuclear posturing by the Kremlin upends decades of foreign policy detente. Biden’s energy windfall tax idea (and the U.K.’s implementation of the latter) are probably not great for investor confidence either.
There surely are many risks in the world, but there are also many positives. Investors ignore the latter at their own peril.
QuantStreet
As we wrote last month, Quant Street entered October with risk targeted at the level of our benchmark, the MSCI All Country World Index (ACWI). Our October performance was strong, with the core strategy up 6.8%, an outperformance relative to ACWI of close to 0.80% on an after-fee basis.
After-tax performance of QuantStreet’s core strategy and some benchmarks. LTD refers to our life-to-date performance, which starts on December 1, 2021. Source: QuantStreet, Bloomberg
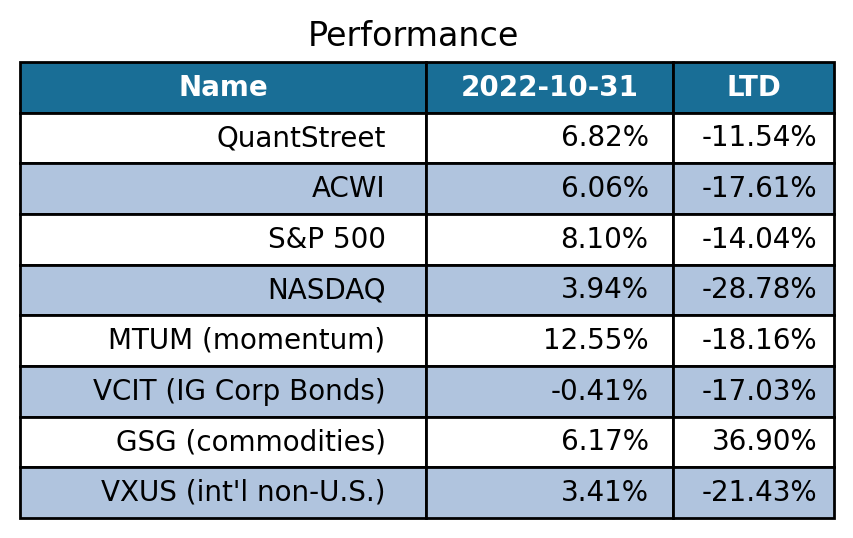
At the start of October, we decreased our position in investment grade corporate bonds (VCIT) and in momentum stocks (MTUM), and initiated a new position in international non-U.S. stocks (VXUS). The VCIT to VXUS switch helped performance in October, while the MTUM to VXUS switch hurt. Overall, we did well relative to the benchmark, which brings our after-fee outperformance relative to the ACWI to over 6% since our launch in December of 2021.
One of the major benefits of a systematic approach to investing is that the forecasting and allocation models cut through the myriad currents we discussed in the preceding section, and combine historical precedent with current data to form an optimal (highest expected return) portfolio at the targeted risk level. In addition, when the allocation model is somewhat indifferent between two portfolios, we try to implement the one which results in realized tax losses for our clients, when possible.
For the month ahead we maintain our exposure to the S&P 500 index and high quality corporate bonds, lower our exposure to non-U.S. international stocks, and reintroduce a small exposure to momentum (MTUM, which currently overweighs consumer staples and energy, and had a stellar performance in October).
In terms of risk targeting, our ACWI benchmark has been running a 19% volatility over the prior year. We are targeting a 20% volatility for the portfolio, which reflects our subjective assessment that risk assets are attractive despite — or perhaps because of — persistent investor negativity.
[1] See the CNBC article: https://www.cnbc.com/2022/10/