May 5, 2022 —
In a Nutshell: April was a tough month for global markets. Although QuantStreet’s performance followed the markets (down), we continued to outperform both our benchmark (MSCI ACWI) and the S&P 500. We’ve moved part of the portfolio into cash and are positioned for more turbulence ahead. Read on for details.
Markets in April
It’s been written that “April is the cruelest month.” And so it was this year. War continued to ravage Ukraine, and financial markets experienced bouts of turbulence not seen since the early days of the COVID-19 pandemic. The table below shows selected asset class performance in April:
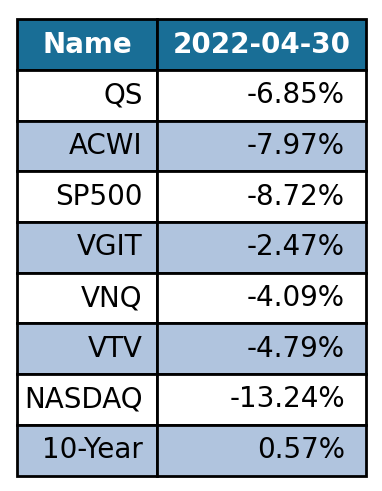
**Each row of the table refers to either the name of an index (e.g., S&P 500 or the NASDAQ) or an ETF (e.g., VNQ, VTV). The 10-Year row shows the monthly change in 10-year Treasury yields.
With regard to our own performance, let’s start with the good news: QuantStreet (QS) performed a full percentage point better than our benchmark (the MSCI All Country Work Index) bringing our launch-to-date outperformance against the ACWI to 3.40%. QS also performed about 2% better than the S&P 500, the most widely followed U.S. stock market index. Now the bad news: Consistent with the markets more generally, QuantStreet was down 6.85%, certainly an undesirable monthly return.
We went into the month with roughly the following portfolio: 7.5% in real estate investment trusts (VNQ); 60% in S&P 500; 12.5% in Treasuries (VGIT); and 20% in value stocks (VTV). As the table above shows, besides the S&P 500, all components of the QS portfolio outperformed the S&P 500. Treasury bonds fell in price (10-year Treasury yields rose more than 0.5% in the month and Treasury prices move in the opposite direction to yields), but are generally much less volatile than stocks, and so were down “only” 2.5%. Very often, when stocks sell off, Treasuries go up in price, but that did not happen this month because bonds and stocks fell for the same reason (read on!).
Value stocks and real estate investment trusts (REITs) outperformed – by a lot. To see why, note that a large part of the S&P 500 is made up of technology stocks (Apple, Microsoft, Amazon, Tesla, and Google are the top five companies) and technology stocks had an abysmal month in April, down over 13% (see NASDAQ, a tech-heavy index, in the above table). But old economy value stocks did well (Warren Buffett’s Berkshire Hathaway, UnitedHealth, Johnson & Johnson, and Procter & Gamble are the biggest components of VTV).
Inflation Woes
The reason for much of what happened in April is that the market (ourselves included) became even more convinced that the Federal Reserve needs to, and will, take strong anti-inflation actions. The world is in the midst of a major inflation scare: the last time inflation was this high was in the late 70s and early 80s (see chart). The Fed is under heavy pressure to control inflation, which it does by raising short-term lending and borrowing rates for banks; this is called tightening of monetary policy. These rate increases, in turn, feed into interest rates on longer-term Treasury bonds (thus the sell off in VGIT). Once rates go up, stocks begin to look less attractive relative to bonds, and stock prices also begin to fall.

**The chart shows year-over-year inflation (measured using the Consumer Price Index) going back to the start of the post-war era. Source: Bloomberg
Which stock prices typically fall the most? The stock prices of firms that are most sensitive to increases in interest rates. Compounding interest means that the more sensitive firms are those whose cash flows are in the more distant future, e.g., Amazon, Tesla, Google. The least sensitive firms are those with more immediate cash flows, e.g., UnitedHealth, Johnson & Johnson, Procter & Gamble, and real-estate assets (like REITs). (As an aside, stocks have done quite well over the last several Fed tightening cycles, but that is a story for another day.) Fortunately, our return forecasting and portfolio optimization models overweighted QS’s exposure to value stocks, REITs, and Treasuries, which helped our performance relative to the S&P 500. Our performance against ACWI was also helped by these factors, as well as by the strengthening dollar (that too is a story for another day).
So what are our (and your) algorithms saying now? We are maintaining roughly the same value and REIT exposures as last month, with a slightly higher allocation to the S&P 500. But our entire Treasury position has been moved to cash. The QS portfolio engine tries to squeeze every bit of expected return out of its allocated risk budget in every month. Usually, this means putting some cash into bonds because they have low volatility, (often) negative correlation with stocks, and positive, if typically low, expected returns. But this month, the expected return on bonds – which combines the output of our machine learning forecasting model with past bond performance – is negative, reflecting the disastrous performance of bonds over the last few months. At some point the positive bond return forecast from the machine learning model may win out, but not yet. So dynamically risk targeting to the ACWI leaves us sitting in stocks and cash.
Sometimes prudent risk-taking means not going all in. Now is such a time.