January 18, 2025 —
In his recent FT piece “How ‘the mother of all bubbles’ will pop,” Ruchir Sharma lays out the case for why U.S. stock market outperformance relative to the rest of the world is unlikely to continue.
Our view has been that the substantial outperformance of U.S. versus international markets has been driven (to a large extent) by faster earnings growth. The underpinnings of that growth are likely structural in nature: the U.S. features a more pro-shareholder culture, more research and innovation, and more freedom and better legal safeguards for corporations. These factors argue for continued U.S. outperformance.
However, Sharma does have a point. A lot of the good news about U.S. stocks has been priced in. The next chart shows the price-to-forward-earnings ratio—the price relative to one-year ahead analyst earnings expectations—of the U.S. market (SPX), relative to Europe (SXXP), Asia (MXAP), and world stocks excluding the U.S. (MXWOU).

In the early years of the millennium, U.S. stocks traded at a price-to-earnings (P/E) discount to the rest of the world. By the time of the global financial crisis (GFC) of 2007-2009, the valuation of U.S. stocks had caught up with that of international peers, and since then U.S. valuations have raced ahead of the pack. As of the end of 2024, the U.S. P/E ratio of 24.88 was approximately 10 turns higher than the P/Es of European and Asian stock markets.
Finance 101 teaches us that stock price multiples reflect two factors: discount rates (higher discount rates mean lower prices) and expectations about future earnings growth (higher growth expectations mean higher prices). Unquestionably, part of the valuation differential reflects the belief that U.S. companies will have higher earnings growth in the future, either because of higher top-line growth, margin expansion, or greater share buybacks which increase earnings-per-share (EPS) by decreasing share count.

As the above chart shows, over the last 20 years, U.S. per-share earnings have grown at close to 7% per year, while European and Asian corporate earnings growth has been around 5%. With the tail wind of the AI revolution, the market is betting that this earnings growth differential will persist, and perhaps even widen.
Another important consideration for projecting relative stock performance is that non-U.S. stock markets now pay considerably higher dividends. The next chart shows the last-12-month dividend yield of U.S. and global stock markets. The U.S.’s 1.27% dividend yield is swamped by the 3.41% dividend yield of European stocks and the 2.42% dividend yield of Asian stocks.

The U.S.’s relatively low dividend yields and relatively high P/Es mean that U.S. earnings growth has to be that much higher than in the rest of the world for U.S. stock market outperformance to continue.
Reversion-to-the-mean returns
To understand how future returns may be impacted by these three forces—P/Es, dividend yields, and earnings growth—we perform a simple simulation. In the case of the U.S., we assume its current dividend yield will approach its historical dividend yield in a straight-line fashion over the next 10 years. Similarly, we assume the U.S. price-to-forward-earnings ratio will go from its current level to its historical average level over the next 10 years. We assume an initial earnings per share expectation of $1 (or 1 unit of local currency for non-U.S. markets) and that this grows at the compounded annual EPS growth rate observed over the last 20 years (i.e., our assumption is that earnings expectations grow at the same historical rate as actual earnings). At the end of each simulation year, the price is the end-of-year expected earnings multiplied by the end-of-year P/E ratio.

The return on invested capital (assumed to start at $100 or 100 local currency units) in a given year equals the price appreciation from that year plus the dividend yield that prevailed at the end of the prior year. For U.S. stocks, should dividend yields and P/Es revert back to their historical averages over the next 10 years, and should earnings growth equal its 20-year average, the annual rate of return would be 4.72%.
The next table summarizes this analysis for all four global markets. All returns are calculated in local currency terms. We argue in the Appendix that comparing returns while ignoring exchange rate effects is an acceptable approximation. The top row of the table replicates the results of the above chart and shows a prospective annual U.S. equity return of 4.72%. For Europe, despite its lower historical earnings growth rate, the high dividend yield and low P/E ratio combine to generate a forecasted reversion-to-the-mean annual return of 9.22% over the next 10 years. For Asia and global non-U.S. stocks, the analogous projected annual returns are 7.98% and 8.47% respectively.

In the reversion-to-the-mean scenario, the anticipated U.S. stock return is low because the projected decline in P/Es and low dividend yield offset the relative high U.S. earnings growth rate. European and Asian stock returns are higher, despite lower earnings growth, because of projected P/E expansion and higher dividend yields in the mean-reversion scenario.
Analyzing more scenarios
Thus far, we’ve analyzed the single scenario of everything returning to its historical average over the next 10 years. It is possible, likely in fact, that this is not what the market believes. The market may think that U.S. P/E ratios are now at a permanently higher steady state level than in the past (due to, for example, higher expected earnings growth) and that U.S. earnings growth over the next 10 years may be higher than its historical 20-year average.
What would have to happen to 10-year ahead P/Es and 10-year ahead earnings growth rates for the U.S. market to outperform the European reversion-to-the-mean returns shown above. The next table shows the projected 10-year ahead U.S. stock returns at different assumed ending points for the P/E ratio and for different assumed earnings growth rates. To make the analysis easier, we assume the same dividend yield progression—from the current level to the historical average—over the 10 years of the simulation.

The cells shown in green (and marked with an asterisk) show scenarios where U.S. stocks outperform the European stock base case return of 9.22%. Future winning-path P/Es can be as low as 19 times, as long as earnings growth comes in at 11% per year. If earnings growth comes in at only 9%, then future U.S. P/Es would have to be at least 22 times. And even if U.S. P/Es don’t fall, i.e., end at 25 times, earnings growth would still have to come in at a robust 8% for U.S. stocks to do better than the European mean-reversion base case. (The hurdle rates for U.S. outperformance against the mean-reversion base case Asian stock return are a bit less demanding, and are shown in the Appendix.)
Is the high level of earnings growth needed for sustained U.S. outperformance reasonable? The next chart shows the annualized earnings growth over the prior 10 years for each of the four asset classes. The one episode of very high recent earnings growth was the 10-year period that began in late-2009, at the earnings trough following the global financial crisis, and which ended in late-2019, just prior to the onset of COVID-19.

In this case, the S&P 500 10-year growth rate peaked as of December 31, 2019 at a annualized rate of 10.95%. The growth rate of Asian earnings was even higher, at right around 20%. But both of these high growth rates came off of very depressed post-GFC earnings levels. While a 10-year ahead earnings growth rate of 9 or 10% is certainly possible, it is a tall order, even accounting for the productivity gains likely to accrue from AI adoption.
Next, we flip the tables and ask what sort of forward P/E ratio and earnings growth would be needed for European stocks to outperform the 4.72% return in the mean-reversion scenario for the U.S. market. This picture is exceedingly benign. Short of a lost decade of growth with disastrously low earnings coupled with a downward repricing of European equities, it is hard to see how European stocks—with their relatively low valuations, decent earnings growth, and high dividend yields—don’t eke out a higher-than 4.72% gain. (The table below has the same P/E and EPS scale as the U.S. versus Europe table shown above.)

The Appendix shows that the outperformance path for Asian stocks relative the U.S. base case is a bit more challenging than for the Europe-versus-U.S. comparison. Similarly, the Appendix shows that in most scenarios, European stocks are likely to outperform the Asian mean-reversion scenario stock returns.
The mother of all bubbles?
Are U.S. stocks in a massive valuation bubble? We don’t think so. Will U.S. stocks outperform their European and Asian counterparts over the next 10 years? Maybe. But it will require a combination of a historically elevated future P/E ratio and very robust earnings growth over the next 10 years. A more likely scenario is a bit of P/E mean reversion, say to 20 times, with strong earnings growth, say 8%, which would result in an annualized 10-year ahead U.S. return of 7.23%. This would be a perfectly good return outcome for the U.S., but it is lower than the mean-reversion base case for Europe, Asia, and the rest of the world excluding the U.S.
Of course, it is possible the U.S. really will chalk up 10%+ earnings growth (or, more precisely, growth of earnings expectations) on the back of an AI productivity boom. In that case, the U.S. market will likely again be the winning global stock market over the next 10 years. Only time will tell, but the valuation case for non-U.S. global markets is as compelling as it’s been in a while.
Looking ahead
Our philosophy at QuantStreet is to combine tactical and strategic thinking. The above analysis falls into the strategic category: Based on a long-run analysis of P/E progression and earnings growth, the bar for U.S. outperformance is very high. Europe and Asia have an easier path—just reversion to the mean—to achieve future outperformance versus the U.S. But long-term thinking and medium-term thinking in markets often don’t align. In the medium-term, other dynamics matter besides valuations and earnings growth. These latter considerations are captured by our machine learning one-year ahead return forecasting model blended with a one-year (ex-last-month) trend signal. Portfolios should reflect both strategic and tactical considerations.
QuantStreet is a registered investment advisor. It offers wealth planning, separately managed accounts, model portfolios and portfolio analytics, as well as consulting services. The firm’s approach is systematic and data-driven, but also shaped by years of investing experience. To work with or learn more about QuantStreet, contact us at hello@quantstreetcapital.com.
Appendix
Our analysis thus far has ignored currency effects. Fortunately, the relative level of the euro versus the dollar has not shown any evidence of a trend over the last 50 years (the data prior to 1999 are from a euro-like currency basket).

The same is true of the dollar against a broad currency basket over an even longer time frame.

The next table shows the ending P/E and earnings growth assumptions needed for U.S. outperformance relative to the Asian mean-reversion base case.

The next table shows the ending P/E and earnings growth assumptions needed for Asian outperformance relative to the U.S. mean-reversion base case.

The next table shows the ending P/E and earnings growth assumptions needed for European outperformance relative to the Asian mean-reversion base case.

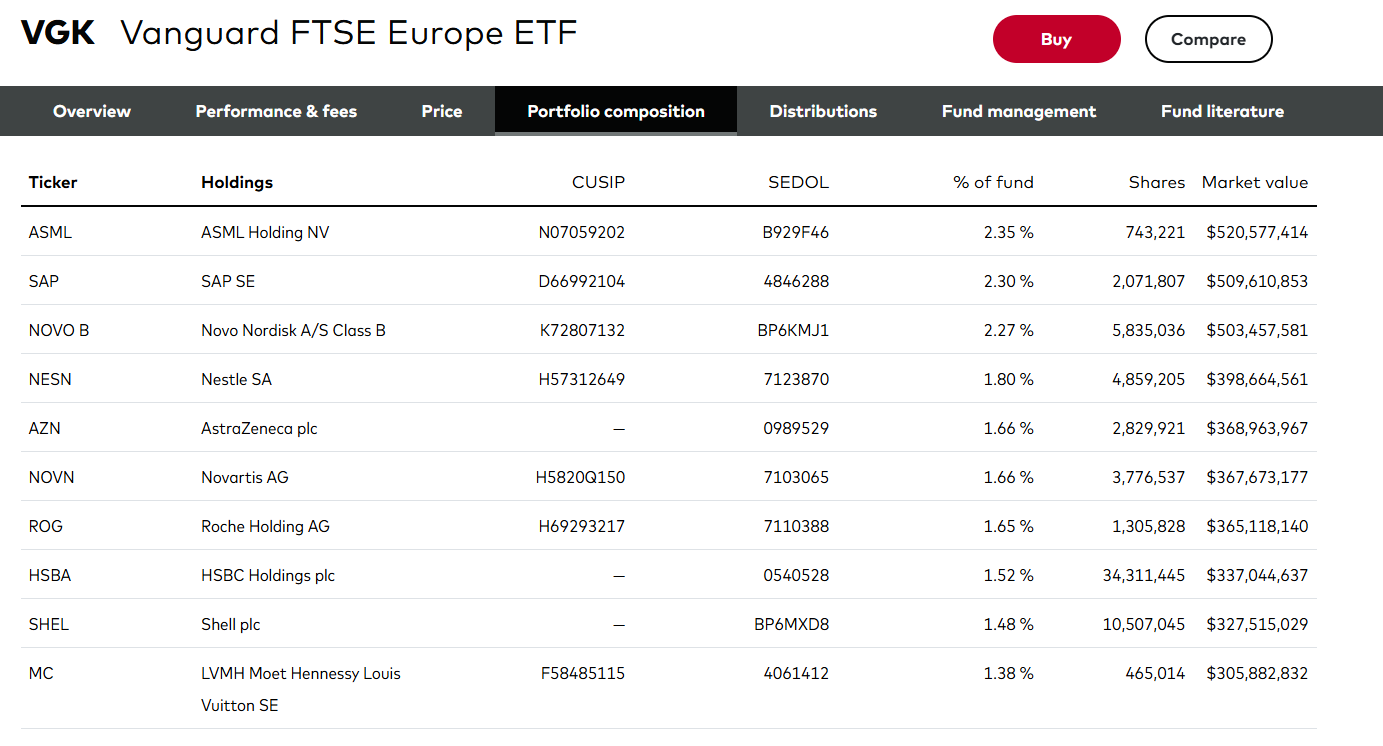
The next table shows the top companies in Vanguard’s VGK ETF, which tracks the European market. The top companies are global leaders in semiconductors, software, healthcare, food and drink, energy, fashion, and finance. The composition of the MXAP index is shown here.