August 1, 2024 —
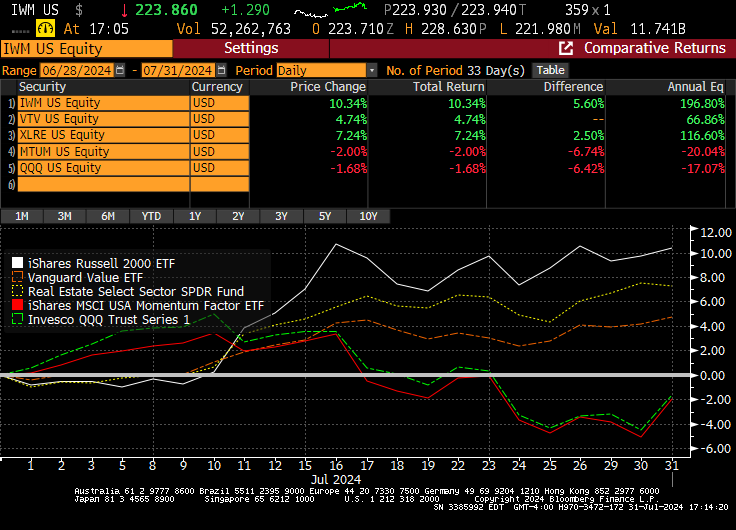
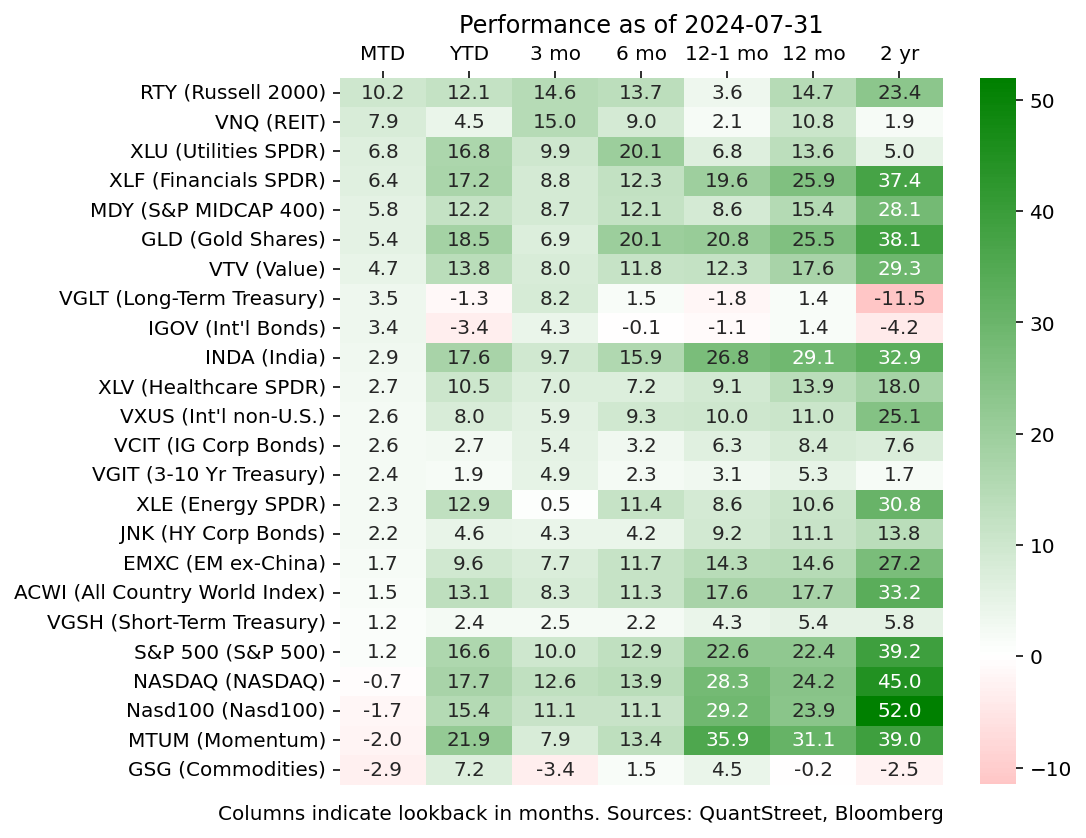
Despite a partial reversal on the final trading day of the month, July saw a large momentum crash with past winners (tech, MTUM) underperforming and past underperformers (small caps, value stocks, REITs) having a stellar month. More broadly, much of what’s been out of favor for the last year had a strong rally in July.
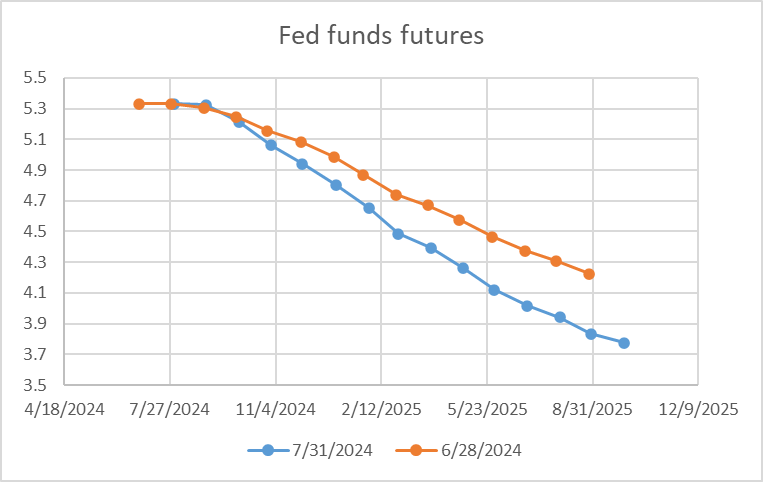
Past academic work has documented that momentum crashes happen around bottoms of bear markets, but that’s not what this momentum crash looks like. The move started on July 11th with benign inflation data, with year-over-year CPI coming in at 3% versus 3.1% expectations. Couple that with anecdotal evidence about slowing growth (e.g., “America’s Post-Covid Factory Boom Is Running Out of Steam,” WSJ and “Diageo warns on ‘extraordinary’ consumer environment after sales drop,” FT), and the market experienced a strong reassessment of its views on Fed easing from month-end June to month-end in July. The long-end of Fed funds futures dropped around 40 basis points, with the first rate cut now expected to come in the September meeting.
Investors interpreted this move in rates as favoring the non-growth parts of the market, which was associated with the price action summarized below:
Does it all make sense? With the caveat that there are many more market theories than real explanations, let me advance another theory for why the July price moves are unlikely to persist. First, if the acceleration of Fed easing is due to slowing economic growth, that growth will disproportionately impact value and small cap earnings. Value companies tend to have higher short-term cash flows (relative to growth stocks) and are typically more economically sensitive. The same goes for small caps, except with small caps you can also add in high leverage. Second, since growth stocks have further-out cash flow — i.e., growth stocks trade at high price-to-earnings multiples because future earnings are anticipated to be much higher than current ones — they are more interest rate sensitive than value stocks.
When growth slows and rates fall, what will happen to an asset class with long-dated cash flows that are not very economically sensitive? Well, it is likely to strongly outperform. Ergo the short-term outlook for growth relative to value/small caps appear to be rosy.
Long-term fundamentals
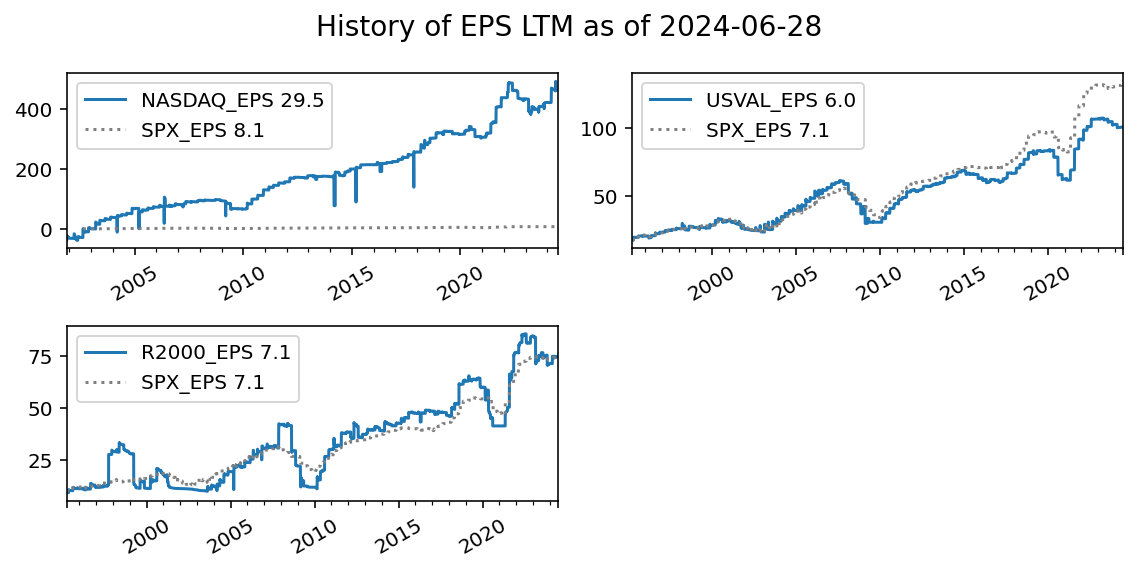
The short-term setup — slowing economic growth and an accommodative Fed — favors growth stocks (e.g., tech, momentum) over value and small caps. But the fundamental backdrop over the last several decades has also been supportive of growth. Nasdaq earnings-per-share (EPS) growth has far outstripped that of the S&P 500 (and most other sectors) since 2000. EPS growth of value stocks (6% per annum) has lagged EPS growth of the S&P 500 (7.1%) over the last several decades as well. Small caps (Russell 2000) have had EPS growth in-line with the S&P 500 (both at 7.1% per year going back to the 1990s), but small cap earnings-per-share have been much more volatile. With identical average growth rates and less volatility, S&P 500 earnings ought to command a valuation premium relative to small caps. (And this does not consider the possibility that, going forward, the divergence in growth rates between the S&P 500 and small caps will move in favor of the S&P 500 as economies of scale related to AI technology give large caps stocks an edge.)
Turning to valuations, it is true that the Nasdaq is sitting at a price-to-book (P/B) premium relative to the S&P 500, and value stocks and small caps are trading at a price-to-book discount. Partly, this reflects differences in historical EPS growth rates — if a dollar of capital generates much faster EPS growth in the tech sector, then the market will ascribe that dollar a higher valuation. Another reason for the P/B divergence has to do with how accounting rules treat research and development. Companies that spend heavily on R&D do not capitalize those expenses, which means that R&D investments don’t show up in a company’s book value, and book value becomes understated. We’ve written about this in the past, as has Morgan Stanley.

If P/B is not a perfect measure, what about the excess earnings yield (defined as the average real EPS of an index divided by its share price minus the current 10-year Treasury rate, i.e., E/P – 10-yr rate). Interestingly all excess earnings yields have trended down over the last few years, in response to a strong stock market (high prices) and rising rates. But on a relative basis, the earnings yields of Nasdaq and value stocks have both closely tracked that of the S&P 500. Interestingly, based on the earnings yield metric, value stocks have only a slightly higher earnings yield relative to the S&P 500. Finally, small cap earnings yields are considerably lower than those of the S&P 500. So the price-to-book and earnings yield signals are saying very different things for small caps.

It should be noted that the same capitalization-of-R&D issue that impacts book values for tech firms also tends to understate their earnings. But the effect on book value, which is the cumulative impact of understating earnings over many years, is larger. So, even here, the earnings yields of tech firms are relatively understated and the ones of value and small caps are overstated.
The punchline is that the outperformance of tech and large caps relative to value and small caps has been driven by fundamentals (stronger earnings growth). On pure valuation grounds, when using earnings-based measures, value and small caps don’t look particularly attractive relative to the rest of the market. Throw in the potential catalysts of a slowing economy and Fed rate cuts, and tech and growth stocks are likely to reverse their July swoon in the coming months.
Positioning for the month ahead
With all of this in mind, we followed our usual, process- and data-driven approach to reallocate portfolios for the month ahead. Our models continue to largely support the positioning we’ve had for the last few months. We continue to overweight tech, healthcare, utilities, and gold, and continue to underweight international, small- and midcaps. While the ride isn’t always smooth, we believe our portfolio is structurally well positioned for the months ahead. As always, you can review our past performance here.
Parting thought
We’ve had conversations with some clients about an interesting strategy where we buy the S&P 500 index, sell an upside call option on the S&P 500, and use the proceeds to buy a downside S&P 500 put option. Together with the anticipated dividend yields over the next year, this portfolio will generate a payout in September of 2025 that looks like this:
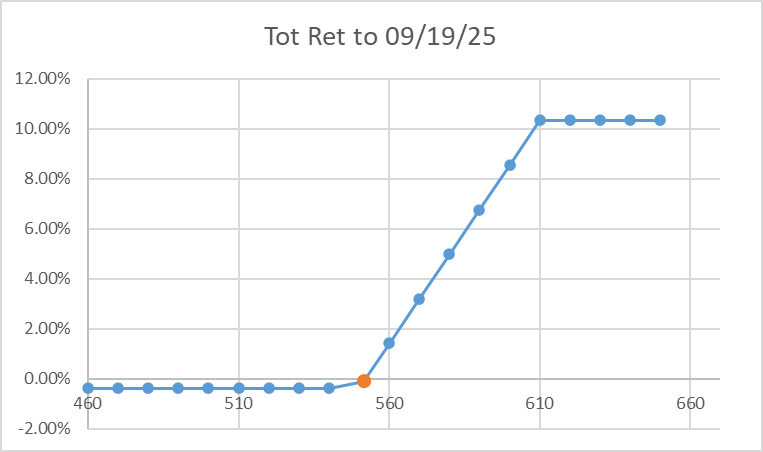
Regardless of how much the market sells off, the loss is capped at about -0.5%. If the market rallies, investors participate in the first 10% of the upside, and then their payoff is capped at just over 10%, regardless of how much more the market rallies. This trade isn’t for everyone, but for those looking for some amount of market participation with limited downside, this trade might make sense. We can implement this trade for you — and its lower and upper bounds can be customized to your particular preferences — at Schwab, our custodian. We’ll be writing more about the economics of this trade in future pieces.
If you are interested in learning more about this trade and whether it might be a fit for your portfolio, or about our analytics- and data-driven portfolio allocation approach and our separately managed account services, please reach out. For our RIA readers, remember that we offer model portfolios and forecasting analytics as a subscription service. Contact us to learn more.
Working with QuantStreet
QuantStreet offers wealth planning, separately managed accounts, model portfolios and portfolio analytics, as well as consulting services to our clients. Our approach is systematic and data-driven, but also shaped by years of investing experience. If you are an existing client or if you are thinking about working with us, we’d love to hear from you. Please reach out to us at hello@quantstreetcapital.com.
Cover picture generated by Gemini.