June 3, 2022 —
The Impending Hurricane
If you’ve been reading financial news recently, you may well be forgiven for deciding to climb under your desk (or kitchen table) and refusing to come out. This past Wednesday (June 1st) the usually measured Jamie Dimon, CEO of JPMorgan Chase, told investors that a “hurricane is right out there down the road coming our way,” though he did hedge a bit with the qualifier that “[w]e don’t know if it’s a minor one or Superstorm Sandy,” but in any case he concluded, “You better brace yourself.” Not to be outdone by its midtown competitor, Goldman Sachs weighed in on Thursday (June 2nd) when Goldman President John Waldron “spelled out his fear that risks from inflation, changing monetary policy and Russia’s invasion of Ukraine could kneecap the global economy.”1
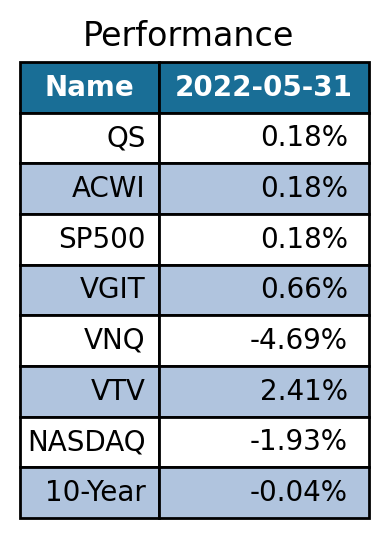
The table shows monthly returns (in %). QS refers to QuantStreet’s monthly performance. ACWI refers to the MSCI All Country World Index. VGIT is an ETF invested in U.S. Treasury bonds. VNQ is an ETF invested in real estate investment trusts. VTV is an ETF that tracks value stocks. Since inception, QuantStreet has outperformed its benchmark (ACWI) by 3.41% and QuantStreet has outperformed the S&P 500 by 3.07%. Since the time of our launch, ACWI is down 9.2%, the S&P 500 is down 8.86%, and we are down 5.79%.
What to make of this negativity? We first note that April was a terrible month for markets, with major stock market indexes down close to 10% (and an even bigger fall for the tech-heavy NASDAQ). May saw the S&P 500 unchanged from April, though with much within-month volatility, while some sectors (like real estate investment trusts and NASDAQ) continued to perform poorly. Together, April and May of 2022 were a bad two months for financial markets.
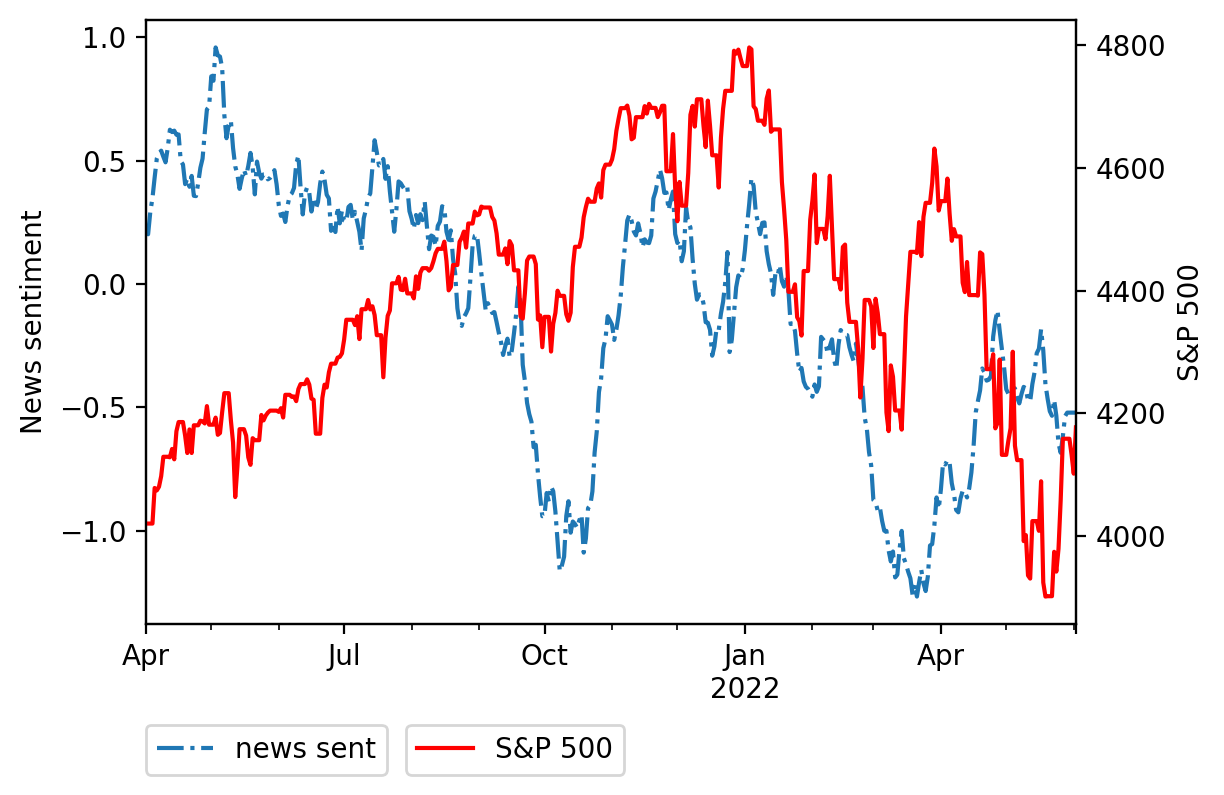
How does past market performance relate to the impending economic hurricane? While it’s obvious that markets respond to news (e.g., bad news cause markets to sell off), academic research has shown that news also responds to markets.2 After major markets (like stocks and government bonds) have fallen precipitously, the media begins to write more negative articles about the state of the economy, in effect coming up with ex-post justifications for already-experienced price drops. The chart below shows the S&P 500 index and an index of media sentiment (higher values mean better sentiment) that we obtained from the San Francisco Fed (see data here). The S&P 500 sold off in September and October of 2021 (on Fed tightening fears), and news sentiment dutifully followed the stock index lower. The S&P 500 then bounced, as did news sentiment. When the S&P 500 sold off again this year, news sentiment again fell, and both stock prices and media sentiment remain depressed.
Investors must recognize that news coverage of (and punditry about) market events sometimes just reflects what has already happened, and provides little new information. Though it certainly is depressing to read financial news the morning after a bad day in markets, sometimes we don’t learn very much that’s new. This isn’t to say there is nothing novel in news. There is. But you have to control for what is already known.
Let’s consider the impending economic hurricane in this context. How much of what Dimon and Waldron said is old news? Certainly, market participants are well aware of inflationary pressures, of a more hawkish Fed, of the tragic war continuing in Ukraine, and of the waning effects of COVID-era fiscal stimulus on consumer spending. In fact, these are the very reasons that markets have plunged over the last two months. So, in essence, neither Dimon nor Waldron said anything new. They just accurately reflected on issues that have been on investors’ minds for weeks, if not months. But prominent media coverage of these remarks can certainly induce the unsuspecting investor to climb under the proverbial table and refuse to come out.
QuantStreet’s Portfolio
As we wrote last month, QuantStreet was positioned conservatively heading into May, with some of the portfolio sitting in cash. We finished the month largely flat, in line with the performance of the S&P 500 and the ACWI (which is our performance benchmark). Since we launched in December of 2021, we have outperformed our ACWI benchmark by 3.4%, while maintaining a risk level in line with the benchmark. For the next month, our portfolio is allocated largely to the S&P 500 index (via the low-cost VOO ETF), with a small position in real estate investment trusts (via the VNQ ETF). We retain a cash position that is slightly larger than last month’s. If you don’t think that sounds like a very exciting portfolio, you’re right. Let us explain.
Recall that our investment process happens in three steps. First, our forecasting algorithms determine expected returns across our asset classes; these expected return forecasts combine the output of our machine learning model with the historical realized returns for the asset classes under consideration. At the same time, we estimate the historical risk and correlation that prevails across these asset classes. In the second step, we choose a risk level for our portfolio, which should be roughly in line (though we can deviate a bit in either direction) with the historical risk level of the ACWI index. This month, we chose a target risk level slightly above that of the ACWI, based on a combination of bad news flow but also more attractive entry points relative to a few months ago. In the third step of the process, our portfolio optimization engine chooses the portfolio with the highest expected return at our targeted risk level.
Why did our portfolio optimizer make the decision that it did? Our machine learning forecasting model is actually quite sanguine on several asset classes, like investment grade corporate bonds or NASDAQ stocks. The problem is that these asset classes have performed very poorly over the last few months. So combining our (bullish) machine learning forecast with the (bearish) realized returns leaves our model lukewarm on these asset classes. The S&P 500 index and REITs are currently the two asset classes with the best blended forecast. They both happen to be more volatile than the ACWI, so to get the correct risk profile, we need to keep some of the portfolio allocated to safer asset classes, like bonds or cash. The portfolio is now in cash because the blended return forecast for bonds is negative. We won’t make money sitting in cash, but at least we won’t lose money either; and it leaves dry powder for the future.
It is tempting to overrule the portfolio process in cases when the model produces “boring” portfolios, by paying attention only to the machine learning forecast, for example. This would currently lead to a cosmetically more pleasant portfolio, allocated across a range of asset classes. But our historical analysis has shown that a blended forecast which combines the machine learning forecast with the historical realized return works better than either forecast on its own. And so we are standing by our process, and sticking with an unexciting asset allocation.
One final note. The current portfolio allocation, of being largely in the S&P 500, is historically anomalous according to our backtests. Our dynamic allocation model is truly that — dynamic. The current portfolio will change, and could change quite a bit, as expected returns and risk estimates change over time. Given the highly dynamic market environment, we are constantly monitoring whether our invested portfolio deviates enough from the new (and ever changing) optimal portfolio to warrant a rebalance. As soon as things change, we will react.