October 14, 2024 —
Over the last 20 years U.S. stocks and bonds have meaningfully outperformed their global peers, both in absolute terms, and on a risk-adjusted basis. The next chart shows the average annualized excess returns [1] of different asset classes, plotted against their annualized volatility. The returns of international asset classes, highlighted in red, are shown in U.S. dollar terms. Points to the upper left of the chart are preferable, because they have higher excess returns (y-axis) and lower risk (x-axis). It is clear that the international asset classes are in all cases far removed from the upper-left-most points of the figure.

World non-U.S. government bonds (WBNDXUS) are clearly dominated by U.S. bonds (USIG, USTIPS, USTREAS) which all have higher average excess returns and lower risk. World stocks ex-U.S. (MXWOU) is similarly dominated by the S&P 500 (SPX), as well as by several sector indexes (healthcare, utilities, and REITs) all of which have offered higher excess returns with lower risk over the last 20 years. Finally, emerging market (EM) stocks (MXEF) and EM ex-China (EMXC) are similarly dominated by the aforementioned U.S. indexes, as well as by Nasdaq, midcaps (MID), and small caps (R2000), all of which have higher excess returns and lower volatility than EM stocks.
The Sharpe ratio (SR), defined as the average excess return of an asset class divided by its volatility, quantifies the amount of return investors earn per unit of risk taken in a given asset class. Higher SRs are desirable since they indicate higher return to risk ratios. As the next chart shows, over the last 20 years virtually all U.S. stock sectors, except financials (FINS), had higher Sharpe ratios than their international peers. Similarly, U.S. bonds had higher Sharpe ratios than international non-U.S. government bonds.

In the last 20 years, U.S. stocks and bonds had considerably higher absolute and risk-adjusted returns relative to their international peers. In the remainder of this article, we explore why U.S. stocks have outperformed and ask whether this outperformance is likely to continue.
Drivers
Certainly valuation multiple expansion is part of the story. The next chart shows the price-to-expected-earnings ratio for U.S., European, and Asian stocks. After trading roughly in line for many years, the valuation gap between U.S. and international stock markets has recently grown quite a bit wider. If the U.S. outperformance story is all about multiple expansion, then it may not persist into the future (as has been argued by Cliff Asness of AQR, for example). Fortunately, the story is not just about the valuations gap.
It is important to note that the sector compositions of U.S., European, and Asian markets are quite different. The U.S. stock market is much more tech-heavy, and the relatively higher valuation of tech firms — which partially reflects the sector’s faster earnings growth — accounts for part of the valuation gap. One manifestation of the difference in sector compositions is the growth rate of earnings, and therefore dividends, in the U.S. relative to other stock markets.

As the above chart shows, tech (NASDAQ) has seen the fastest earnings-per-share (EPS) growth over the last 20+ years. Value stocks’ (USVAL) EPS has grown slowly, relative to the S&P 500 (SPX), while small caps (R2000) and especially midcaps (MID) have seen relatively faster growth. International ex-U.S. stocks (MXWOU) have lagged U.S. EPS growth by 1.9% per year, while emerging market stocks (MXEF) have lagged U.S. EPS growth by 3.5% per year.
To get a sense of what might come next, it is important to disentangle the valuation and growth drivers of U.S. outperformance.
What happens next?
To get a sense of what future returns for U.S. and international stocks might look like, consider the basic Gordon growth model for stock prices: P = D/(R-g), where P is the stock price, D is next year’s expected dividend, R is the expected return from owning the stock, and g is the dividend growth rate. This formula says that dividends grow at g percent per year, and the price equals present values of all future dividends when discounting at the rate R. This formula can be inverted to show that the expected return is equal to the dividend yield plus the anticipated dividend growth rate, or R = D/P + g.
Since higher earnings multiples (like in the U.S.) imply lower dividend yields (D/P), the only way the U.S. might be expected to have higher future returns relative to international markets is if the U.S. ends up having much higher dividend growth rates. We already saw that the U.S. had historically higher EPS growth rates, and assuming that dividend payouts are a relatively fixed portion of earnings, the U.S. might therefore be expected to have higher dividend growth rates as well.
The next table shows that, based on the last year of data, the U.S. indeed has a lower dividend yield (1.29%) than that of European (3.25%) and Asian (2.32%) stocks. To reflect the different dividend yields, in order for all three stock markets to have 8% per year expected returns, the market must believe that U.S. stocks will have annual dividend growth rates of 6.71% (i.e., 8% – 1.29%), versus 4.75% dividend growth rates in Europe and 5.68% dividend growth rates in Asia. This implies a U.S. dividend growth differential of 1.96% versus European stocks and 1.03% versus Asian stocks. If U.S. dividend growth comes in this much higher, then U.S. stocks will earn the same 8% returns as European and Asian stocks, despite having higher valuation multiples. The higher valuation multiples may thus simply proxy for higher expected growth rates.
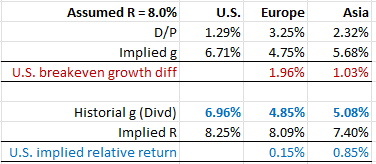
Another take on this question is to consider the actual historical dividend growth rates for U.S. and international stocks. These are given in blue in the above table. Interestingly, historical dividend growth rates are, in all cases, quite close to the implied dividend growth rates that would be needed to achieve 8% anticipated returns, shown in the “Implied g” row of the above table. Adding the historical dividend growth rate to the current dividend yield produces an expected return forecast for all three markets. The U.S. expected return (8.25%) is 0.15% higher than the European expected return and 0.85% higher than the Asian expected return. [2]
Given current valuation levels, as reflected in dividend yields, in order for U.S. stocks to meaningfully outperform European equities in the future, the dividend growth differential between U.S. and European stocks would need to increase from its historical level of 2.11% over the last 20 years. Similarly, to do better than the forecasted 0.85% return advantage vs Asia, U.S. dividend growth rates would need to exceed those of Asian markets by more than the historical 1.88% differential. The next section discusses some reasons why this might happen.
Why U.S. outperformance may continue
Our prior take on why U.S. stocks may continue to outperform their global peers focused on the CATO Human Freedom index, which tracks things like rule of law, property rights, court independence, personal freedom, among many other categories. By these metrics, the gap between the U.S. and the rest of the world, and especially emerging markets, is increasing in favor of the U.S. Other factors favoring the U.S. include: a culture of shareholder activism where underperforming companies are forced to change by market forces; a retirement system heavily reliant on equity market performance which aligns political and shareholder incentives; more reasonable regulation than in other countries; and world leadership in technological innovation.
Some representative headlines from recent articles highlight the issues:
- “Xi Unleashes a Crisis for Millions of China’s Best-Paid Workers,” Bloomberg, September 18, 2024.
- “Meta to European Union: Your Tech Rules Threaten to Squelch the AI Boom,” Wall Street Journal, September 19, 2024.
- “Europe Regulates Its Way to Last Place,” Wall Street Journal, January 31, 2024.
- “Is Red Tape Strangling Europe’s Growth?” Financial Times, September 9, 2024.
- “Glenview Capital Plans Push for Changes at CVS,” Wall Street Journal, September 30, 2024.
There are many other reasons for U.S. dividend outperformance as well, and a full analysis of why the U.S. has and may continue to outperform other global stock markets is beyond the scope of this article. Of course, the future may be quite different from the past and future dividend growth differential might tilt in the favor of European and Asian markets going forward, though that is not our base case.
Long-term perspective
The analysis thus far looks at the last 20 years of data, and converts all asset returns to dollar terms. The next two tables extend the analysis back to 1948, and then back to 1870, using a wonderful data set on country-level stock and bond returns made available at macrohistory.net. Returns are now presented in local currency terms and thus represents the performance available to investors in their home countries. In the post-WWII period, the U.S. and Sweden have been the two best-performing global markets, as measured by their Sharpe ratios (though of course, the size of the U.S. market is vastly larger). The next closest markets are Switzerland, the Netherlands, and Japan.

Going back even further to 1870, the U.S. is now the second best market by Sharpe ratio, trailing only Australia, though Japan is a close third. However, the outperformance of the Australian market appears to be concentrated in the 1870-1945 period because in the post-WWII sample, Australia is a relative laggard.

A key to the performance tables: Stk_ret is the average annualized stock return; Bnd_ret is the average annualized bond return; Stk_xr is the average annualized stock return above a short-term investing rate (e.g., U.S. T-bills); Stk_xr_sd is the annualized volatility of stock excess returns; SR is the annualized Sharpe ratio equal to Stk_xr divided by Stk_xr_sd; Dvd_growth is the annualized rate of dividend growth.
Summary
Based on recent, less recent, and even very old data sets, the U.S. stock market has been the global leader for the last 150 years. Our view is that U.S. market leadership will continue.
It is important to note that U.S. investors may still want to hold international assets in their portfolios even if U.S. stocks are expected to have higher future returns and Sharpe ratios, as long as international assets are diversifying enough and the expected return differential is not too great. We leave this analysis for future research, but note that given historical and potential future underperformance, the bar for including international assets in the portfolios of U.S. investors is quite high.
This article provides educational content only, and is not financial advice. Investing in U.S. and global stocks entails many risks, including the risk of large losses. Your investments should reflect your own risk preferences and liquidity needs. Investment in U.S. or global stocks may not be appropriate for you. Please carefully consider your own circumstances and/or consult a financial professional before making any investment decisions.
Working with QuantStreet
QuantStreet is a registered investment advisor. We offer wealth planning, separately managed accounts, model portfolios and portfolio analytics, as well as consulting services to our clients. Our approach is systematic and data-driven, but also shaped by years of investing experience. If you are an existing client or if you are thinking about working with us, we’d love to hear from you. Please reach out to us at hello@quantstreetcapital.com.
Appendix
The next table explains the security abbreviations used in the main text.

Footnotes
[1] Excess return measures the return of an asset class above the 3-month T-bill rate.
[2] It may bother some readers that the above table leaves out statistics on share buybacks in the U.S. (around 1.85% per year) and internationally (around 1% per year). However, share buybacks will automatically be reflected in historical dividend growth rates. For example, if you own one share of the S&P 500 and never sell, your 1.29% annual dividend yield will grow at 6.96% (assuming history repeats), partly reflecting underlying earnings growth, and partly reflecting the fact that U.S. companies are shrinking their share counts by 1.85% per year, thus boosting per share dividends by the same amount. Therefore, the 6.96% historical dividend growth rate already reflects share buybacks.