November 3, 2024 —
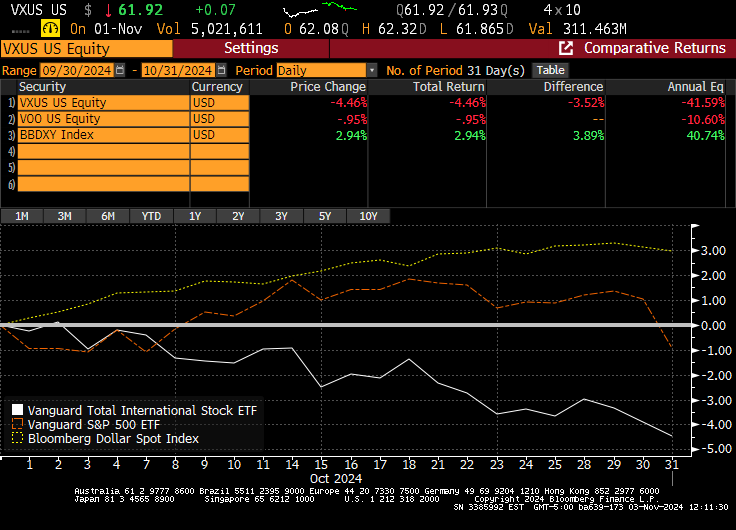
October’s market activity can be neatly summarized in a single chart: the dollar (BBDXY) was strong and U.S. stocks (the VOO ETF tracks the S&P 500 index) meaningfully outperformed international stocks (VXUS). QuantStreet’s portfolios were down on the month, though they moved in line with the overall market. Our performance relative to our asset allocation mutual fund benchmarks, however, was strong. You can read more about our performance here.

Digging a little deeper, the top performers on the month were bitcoin, gold, the dollar, and commodities (financials too). Because their prices are denominated in dollars, it is a little surprising that bitcoin, gold, and commodities all rallied alongside the greenback. All other things being equal, a stronger dollar would imply lower dollar prices for these store-of-value/hard assets. Rarely are all things equal, however, and our interpretation of the price action in October is that investors positioned for a potential tail outcome associated with the U.S. election this coming Tuesday. The concern appears to be less about who wins, and more about a disorderly, contested election.

Reinforcing this view, U.S. interest rates rose meaningfully in the month (GT10 is the U.S. 10-year Treasury yield), as did the VIX, which reflects the implied volatility of short-dated S&P 500 options and is often called the market’s fear gauge.

This rise in interest rates happened despite benign inflation and a slowing job market. Despite robust consumer spending, the market believes the Fed will ease, i.e., cut rates, after its upcoming two-day meeting this Wednesday and Thursday.

Such employment and inflation data, together with an imminent Fed rate cut, would ordinarily be associated with a slowing economy and falling ten-year interest rates. That is unless the market is pricing in a small risk of large problems around the U.S. election, large enough, perhaps, to dent confidence in U.S. Treasuries. Alternatively, the market may believe that regardless of who wins the election, the U.S. is about to engage in profligate spending with a commensurate increase in the supply of U.S. Treasury bonds.
Our own view (and hope) is that, despite what are sure to be some tense moments in the weeks ahead, the U.S. will experience its usual orderly transition of power. Furthermore, we are not believers in the debt-fueled Treasury Armageddon scenario (because ultimately the U.S. will either cut spending, increase taxes, or both), though our ever-increasing debt-to-GDP ratio is certainly far from ideal.
More about tail risk
Now that we are more than two years into a bull market, investor worries invariably turn to the possibility of a large market selloff. Historically, such selloffs tend to happen in good, rather than bad, times. To help think through the relevant issues, we are introducing a new forecasting model for large market selloffs. The model’s goal is to produce an estimate of the probability that the market will experience a more than 20% selloff over the next 12 months. The general idea is to measure the “state of the market” by looking across multiple macroeconomic and financial forecasting variables, and then seeing whether the current state of the market looks like the state of the market prior to past large selloffs.

This intuition is captured using a neural network model (actually two of them) which relate our information about markets and the macroeconomy to the possibility of future large selloffs. The blue line in the above picture shows past occurrences of a large selloff in the subsequent 12 months, and the red and orange series show the model probabilities of such selloffs. With the caveat that it is extraordinarily difficult to say much that is meaningful about the probability of a future large selloff, both of our forecasting models are currently generating rather benign large selloff probabilities. One model forecasts a 13.2% percent chance of a large selloff, while the other model — which happens to be our preferred model — forecasts only a 2.3% percent chance of a large selloff.
We will write a detailed piece about this model in the coming weeks. If you’re interested in learning more, please reach out to us at hello@quantstreetcapital.com.
Looking ahead
Another change to our analytics toolkit is the addition of bitcoin to our model forecasting runs. Full disclosure: We’ve been wrong about bitcoin since it was trading at $1 and our view was that it’s hard to see why you’d pay a whole dollar for something that has zero intrinsic value. $69,999 (or so) dollars later, it sure feels like bitcoin is becoming an asset class in its own right. (Despite our reticence to invest in crypto, we have carefully followed developments in the space. For a wonderful introduction to the underlying theory of trustless blockchain, we recommend Bitcoin and Cryptocurrency Technologies). We are not yet at the point of adding bitcoin to our portfolios, but we are running it through our forecasting analytics and finding that our model has something relevant to say about bitcoin’s future returns. More to come on this.
In light of our large selloff model’s benign market outlook, and despite investor concern about the upcoming election, our portfolios remain largely in line with last month’s allocations. We continue to slowly reduce our Nasdaq position, and make a few sector-level adjustments here and there, but overall we largely stay the course.
Working with QuantStreet
QuantStreet is a registered investment advisor. We offer wealth planning, separately managed accounts, model portfolios and portfolio analytics, as well as consulting services to our clients. Our approach is systematic and data-driven, but also shaped by years of investing experience. If you are an existing client or if you are thinking about working with us, we’d love to hear from you. Please reach out to us at hello@quantstreetcapital.com.
Cover picture generated by Gemini.