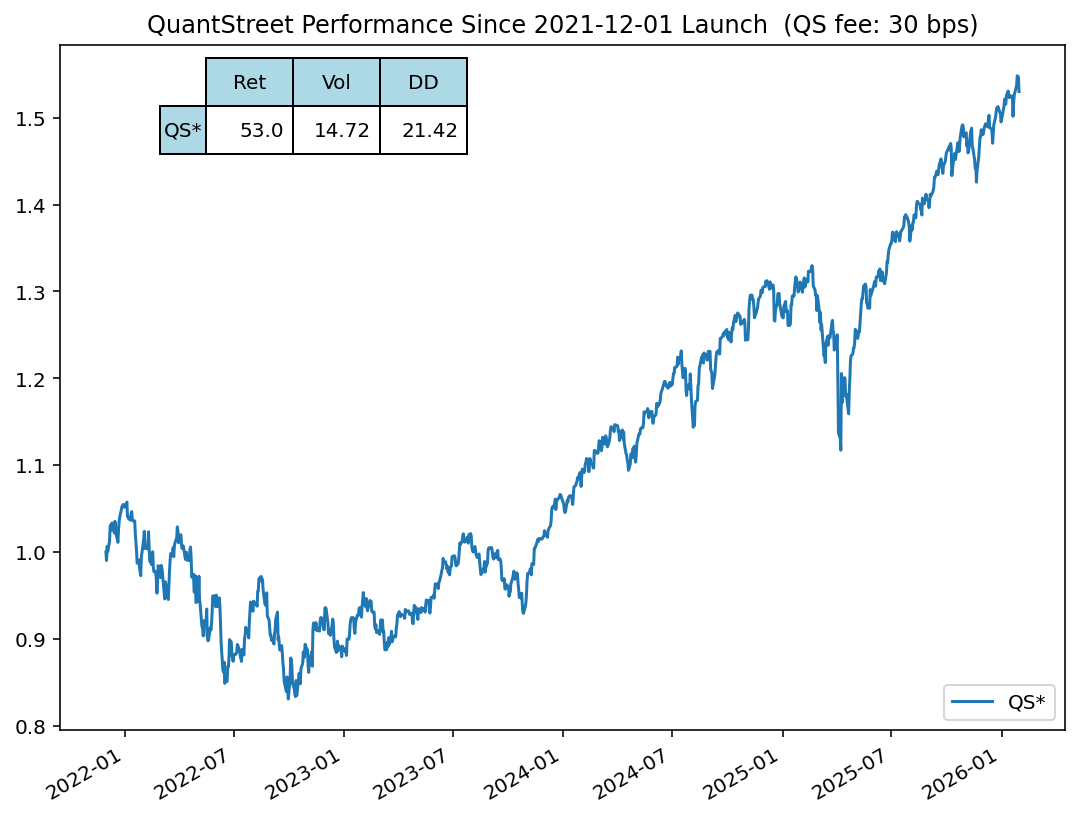
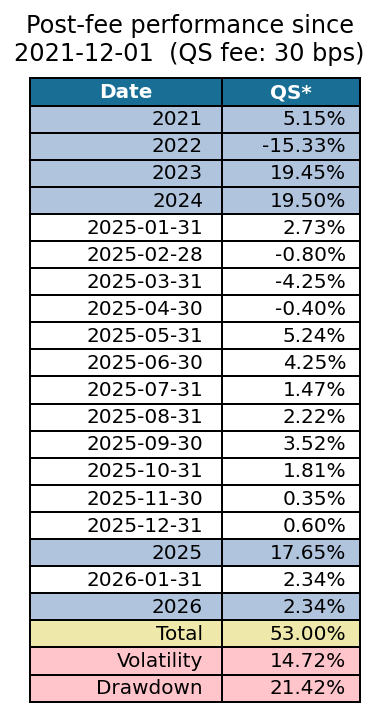
1/31/2026 — The following analysis shows the performance of QuantStreet’s separately managed account strategies.
Strategy Summary
| QuantStreet Strategy | Start Date | Risk Level | Fee (bps) |
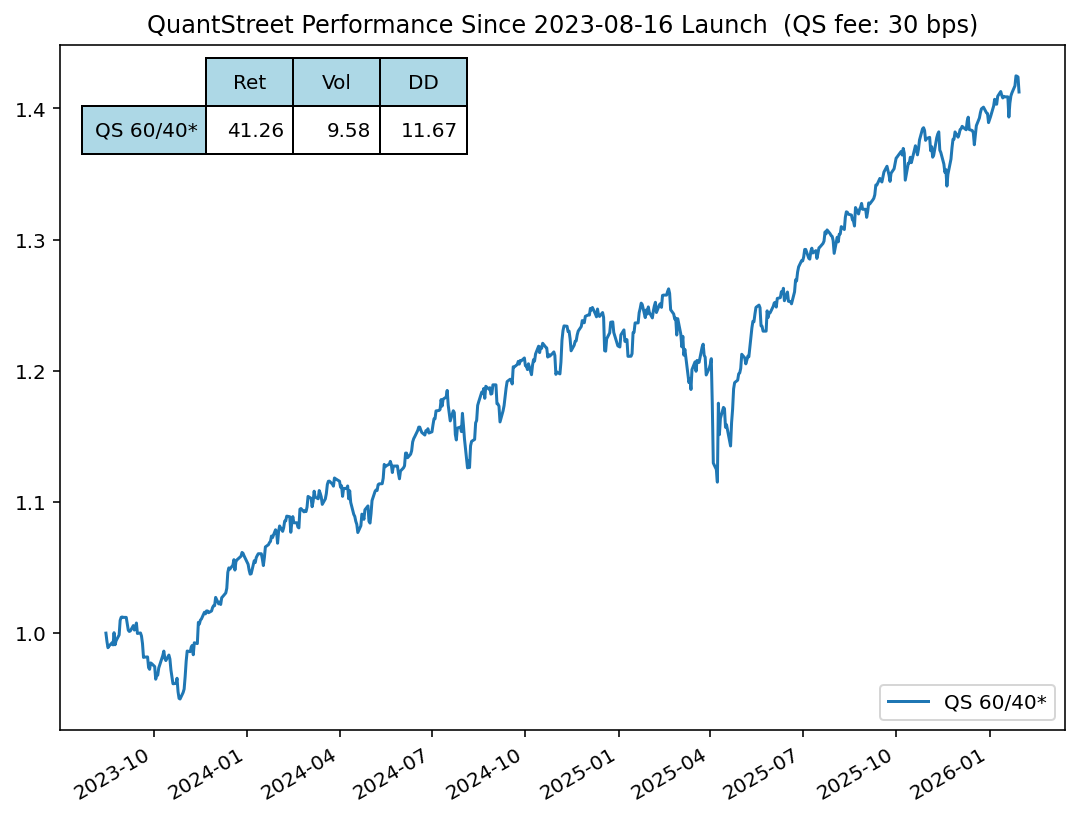
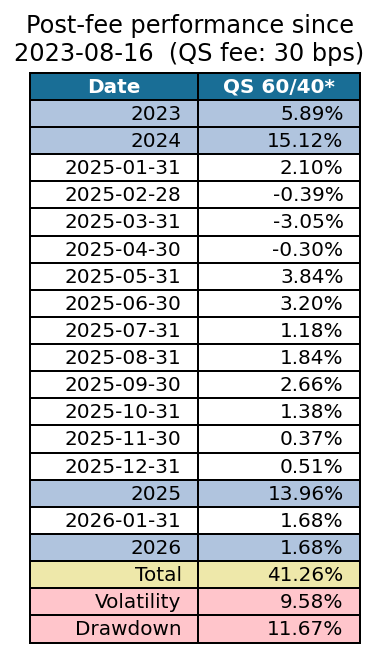
| Balanced | 8/16/2023 | 60/40 | 30 |
| Core | 12/1/2021 | 85/15 | 30 |
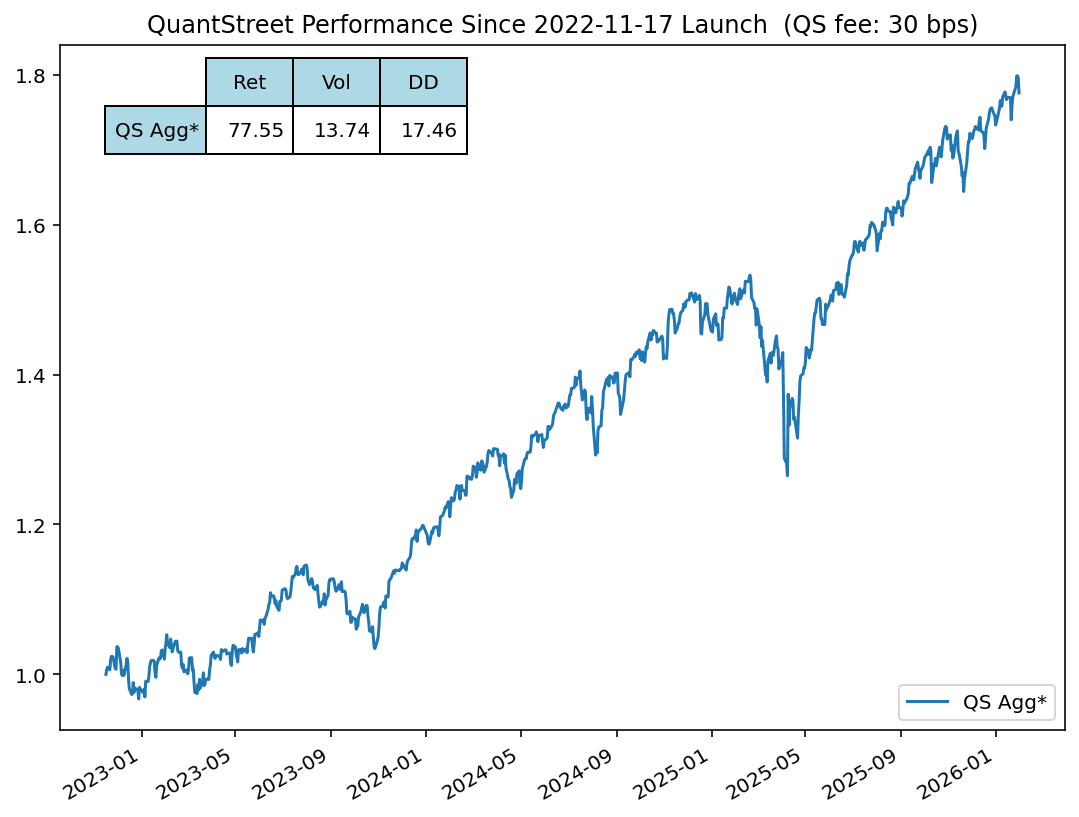
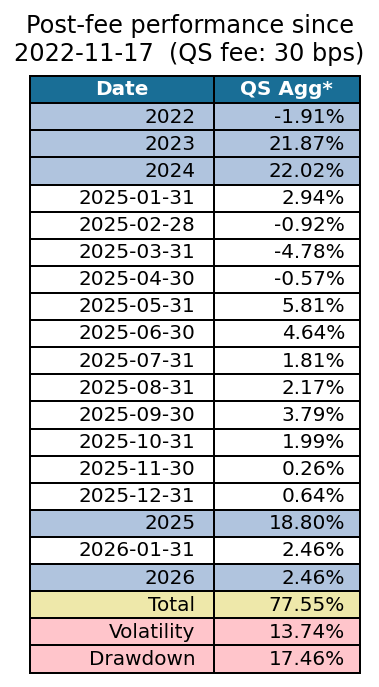
| Aggressive | 11/17/2022 | 95/5 | 30 |
All performance is shown after deducting the above hypothetical fees. Fees are shown in basis points (1 bp = 0.01%). Each strategy targets a risk level corresponding to the stock/bond mix shown in the Risk Level column. Each strategy can deviate from the targeted risk level at the discretion of QuantStreet. We changed the hypothetical fee to 30 basis points (from 40) as of 11/29/2025 to reflect what we charge client accounts for whom we provide only investment but no financial advisory services. Fee levels vary across clients.
Key to exhibits:
- The figure shows the cumulative return of each strategy from its inception date.
- The table shows monthly and annualized net-of-fee (after-fee) returns.
- Also shown is the annualized volatility (Vol) and worst drawdown (DD).
Balanced Strategy
Core Strategy
Aggressive Strategy