December 16, 2024 —
The cyclically adjusted price-to-earnings ratio is now elevated. But should that lead you to exit the stock market? Perhaps not. The predictive power of CAPE has waned meaningfully in recent years.
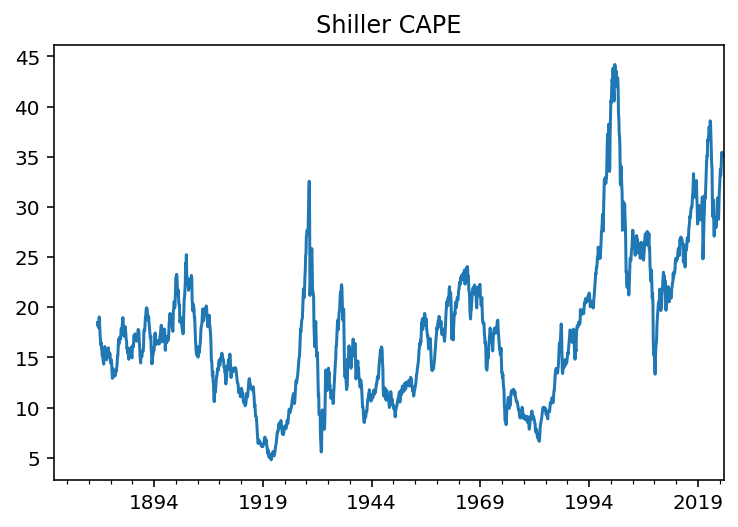
CAPE, or the cyclically adjusted price-to-earnings ratio, introduced in 1988 by economists John Campbell and Robert Shiller, is arguably the best-known indicator of broad market valuation. And CAPE is now at an almost (though not quite) all-time high level, according to data from Robert Shiller’s website. Market commentators have taken note.
In a recent LinkedIn post that references CAPE, AQR writes that “Equity valuations matter (eventually). While equity valuations have continued to rise from already-stretched levels and recent strong stock returns have bolstered many investor portfolios, the future may not be as bright.” James Mackintosh — generally not prone to bouts of optimism about markets — also wrote about the currently high CAPE ratio in a recent WSJ article titled “Is This Wildly Overvalued Stock Market Doomed? Yes, but Maybe Not Yet.” He went on to explain that “History shows no link between nosebleed valuations like today’s and next year’s returns. Expensive stocks can always get pricier.”
We agree with the first part of his explanation: Over the last few decades, elevated levels of CAPE have had no bearing on year-ahead stock market returns. As for the second part, if high levels of CAPE are not associated with future low returns (at least in the past several decades), then one has to question what exactly is the meaning of stocks being “expensive.”
Trend in CAPE
One interpretation of the above figure is that the expected return on stocks is now lower than it has been historically. Applied to market returns over the next ten years, this is the conclusion reached by Goldman Sachs and Bank of America according to the above James Mackintosh article. But there are two alternative explanations that should be considered:
- Investors may expect faster future earnings growth, which could justify a higher price-to-earnings ratio without implying lower future returns.
- Corporate earnings today — thanks to things like the non-capitalization of R&D and marketing expenses — may not be directly comparable to corporate earnings of yore due to disparate accounting treatment.
We wrote about both phenomena in an earlier piece and point the interested reader there. (We plan to explore the first point in more detail in a future research piece.)
If either of these factors is at work — and especially if the accounting treatment of earnings is structurally different now than in the past — then the average level of CAPE may simply have risen over the years. The next picture shows clearly that CAPE has had a pronounced time trend over the last 140 years.
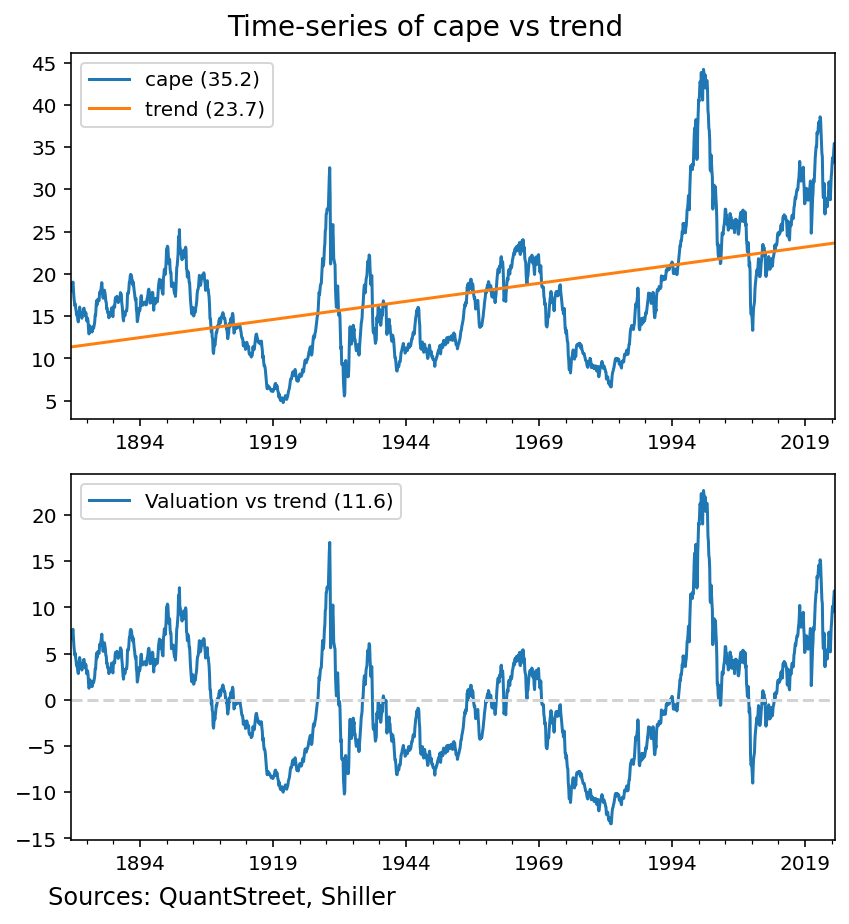
Yet, as the bottom panel of the figure shows, even relative to its pronounced upward trend, the current detrended CAPE ratio is still elevated (though not quite as elevated as the unadjusted CAPE ratio). In light of this, isn’t the market truly overvalued?
What does CAPE forecast?
The overvaluation question is typically addressed by bucketing months based on their ending levels of CAPE and then checking what the forward return looks like in each CAPE bucket. (This is what the AQR piece from earlier did.)
Our version of this analysis is shown in the next table. Each row in the table corresponds to one of nine CAPE buckets, from lowest to highest. [1] The columns corresponds to the average year-ahead return following months that fall into each CAPE bucket, as well as the minimum, maximum, and standard deviation of these year-ahead returns.
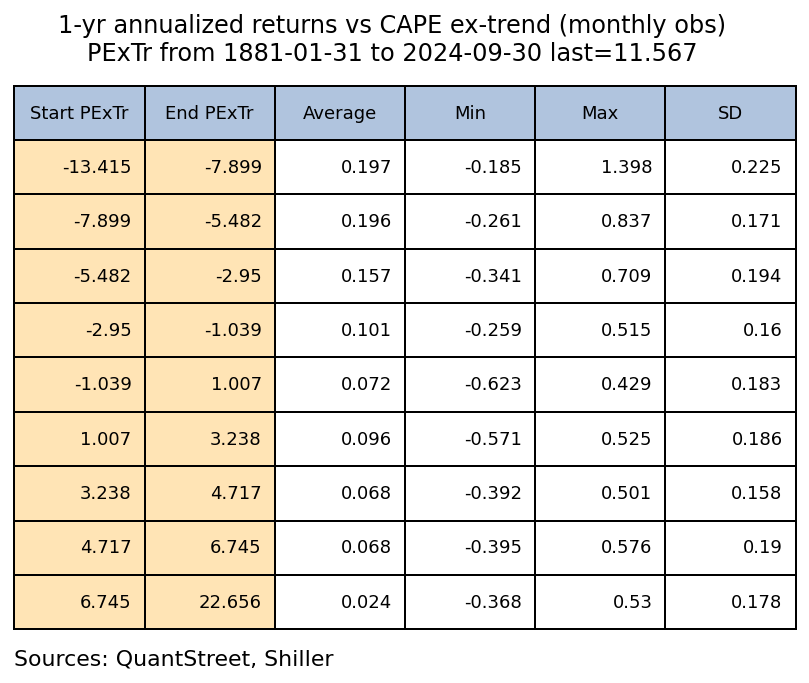
Since 1881, higher detrended CAPE values, i.e., the deviation of the CAPE ratio from trend, have indeed been associated with lower future returns. The lowest detrended CAPE bucket is associated with a 19.7% average year-ahead return while the highest bucket is associated with a 2.4% average year-ahead return. The current detrended CAPE falls into this highest bucket, leading some to conclude that future market returns are likely to be low. However, the full sample averages shown in the table — taken using 140+ years of data — hide important time series variation in how CAPE ratios are related to future returns.
When do the forecasts take place?
The next figure shows each month that falls into one of the nine detrended CAPE buckets from the above table and the associated one-year ahead return. For example, the upper left panel in the figure shows the lowest detrended CAPE bucket which contains months with end-of-month detrended CAPE values between -13.4 and -7.9. The average one-year ahead return following months that fall in this bucket is 19.7%. However, the majority of these data points are from prior decades. The only relatively recent months in this bucket are from the time period of the global financial crisis.
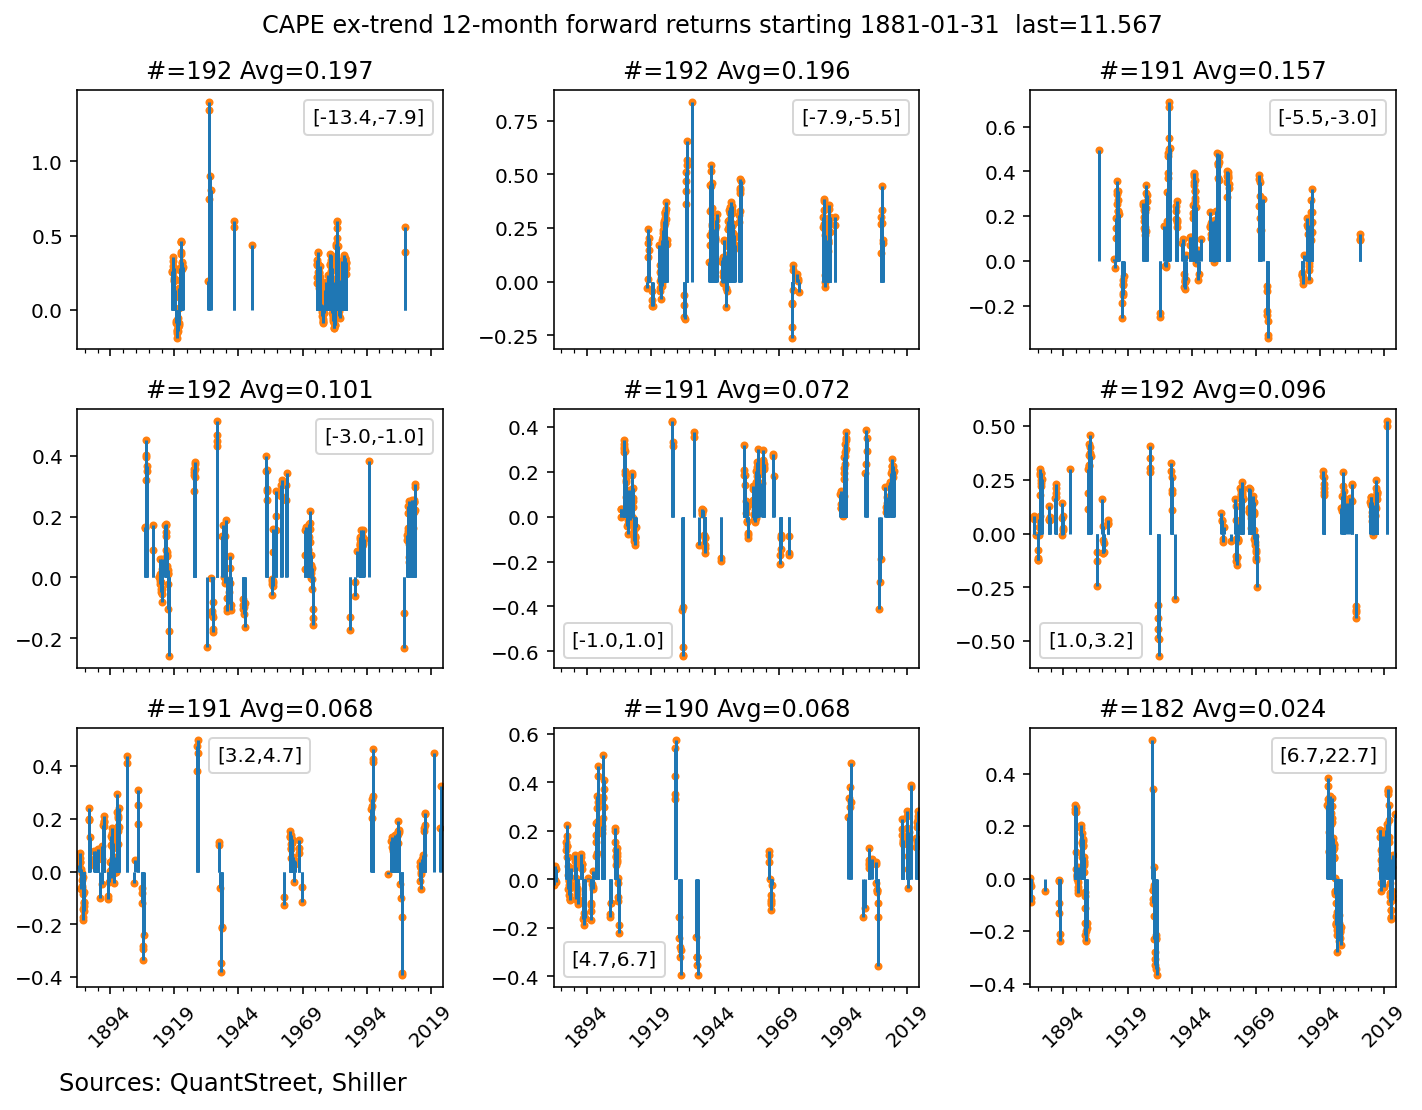
The lower right panel shows the highest detrended CAPE bucket, with CAPE values from 6.7 to 22.7. Conditional on being in this high valuation bucket, year-ahead returns are very low, with an average of 2.4%. However, many of these low returns, and certainly the most negative ones, came in the aftermath of the Great Depression (the local maximum of CAPE happened in September of 1929 at a value of 32.6.). It is hard to argue that the Great Depression stock market experience was caused by high market valuations, rather than by a cascade of poor macroeconomic conditions and bad policy decisions.
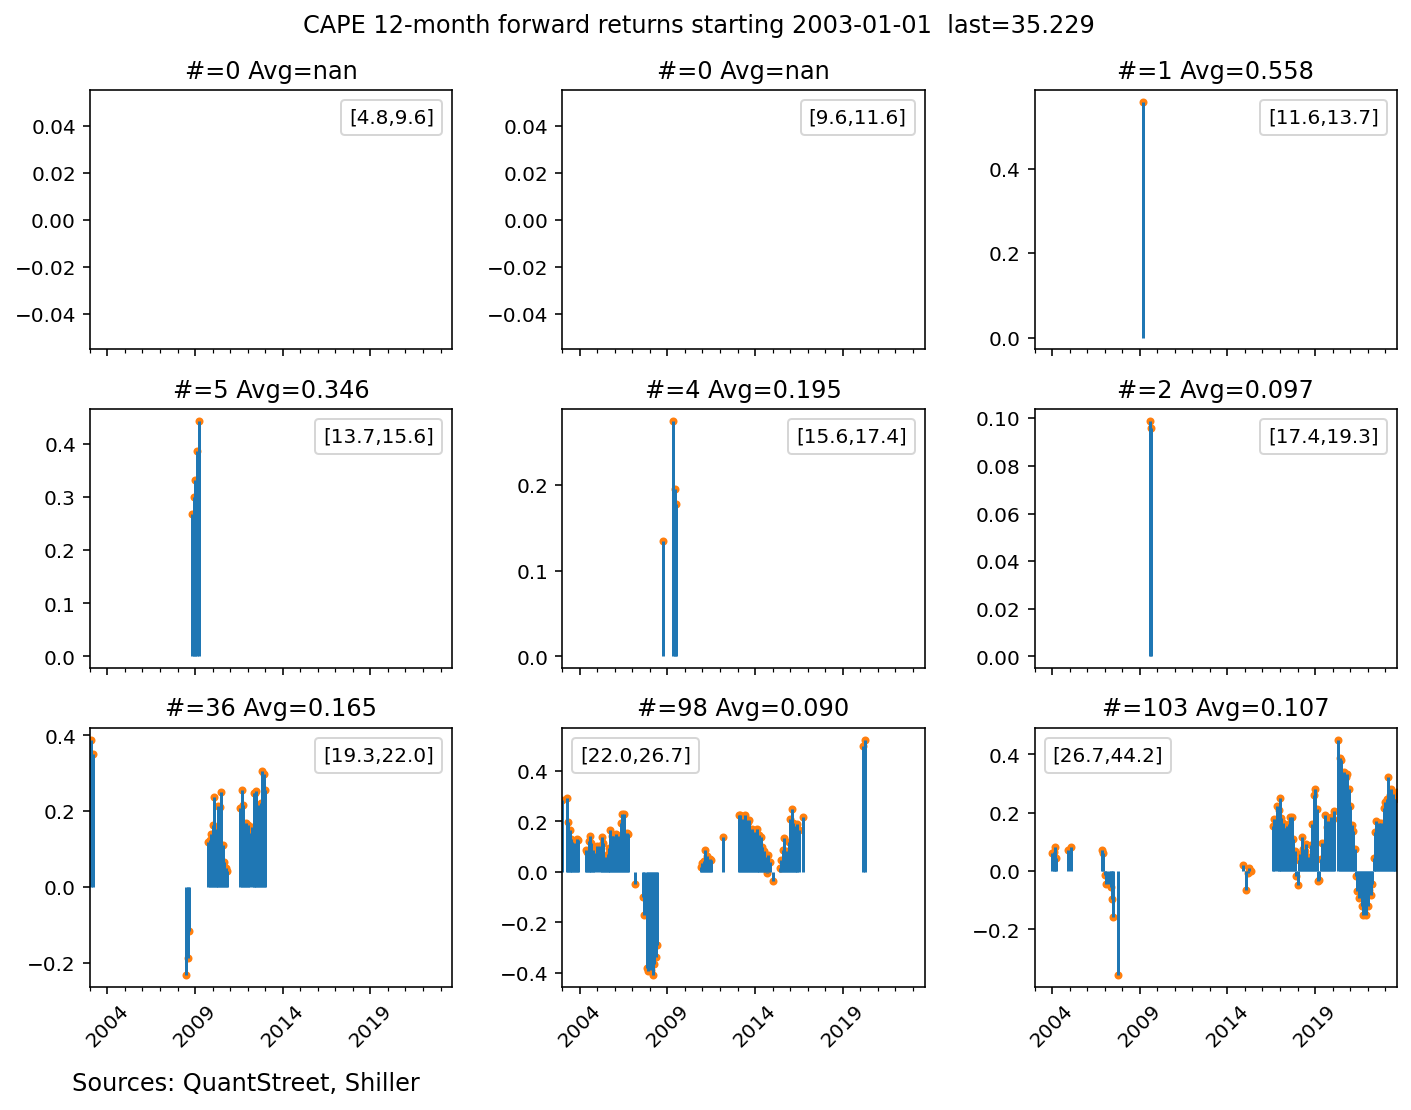
The next figure keeps the same bucket classifications, which use the full data sample, but zooms in on the post-1990 time period. Here, the most frequent detrended CAPE bucket was the high-valuation one, with 108 months falling in this bucket, versus 59 for the second most frequent bucket (which has detrended CAPE values of -1 to 1). In particular for those waiting to invest in the stock market until detrended CAPE falls into one of the three low valuation buckets, you might find yourself out of luck because these buckets contain months that are predominantly from the pre-1990 time period. Almost the entirety of the strong stock market performance over the last three decades took place from relatively high detrended CAPE buckets.
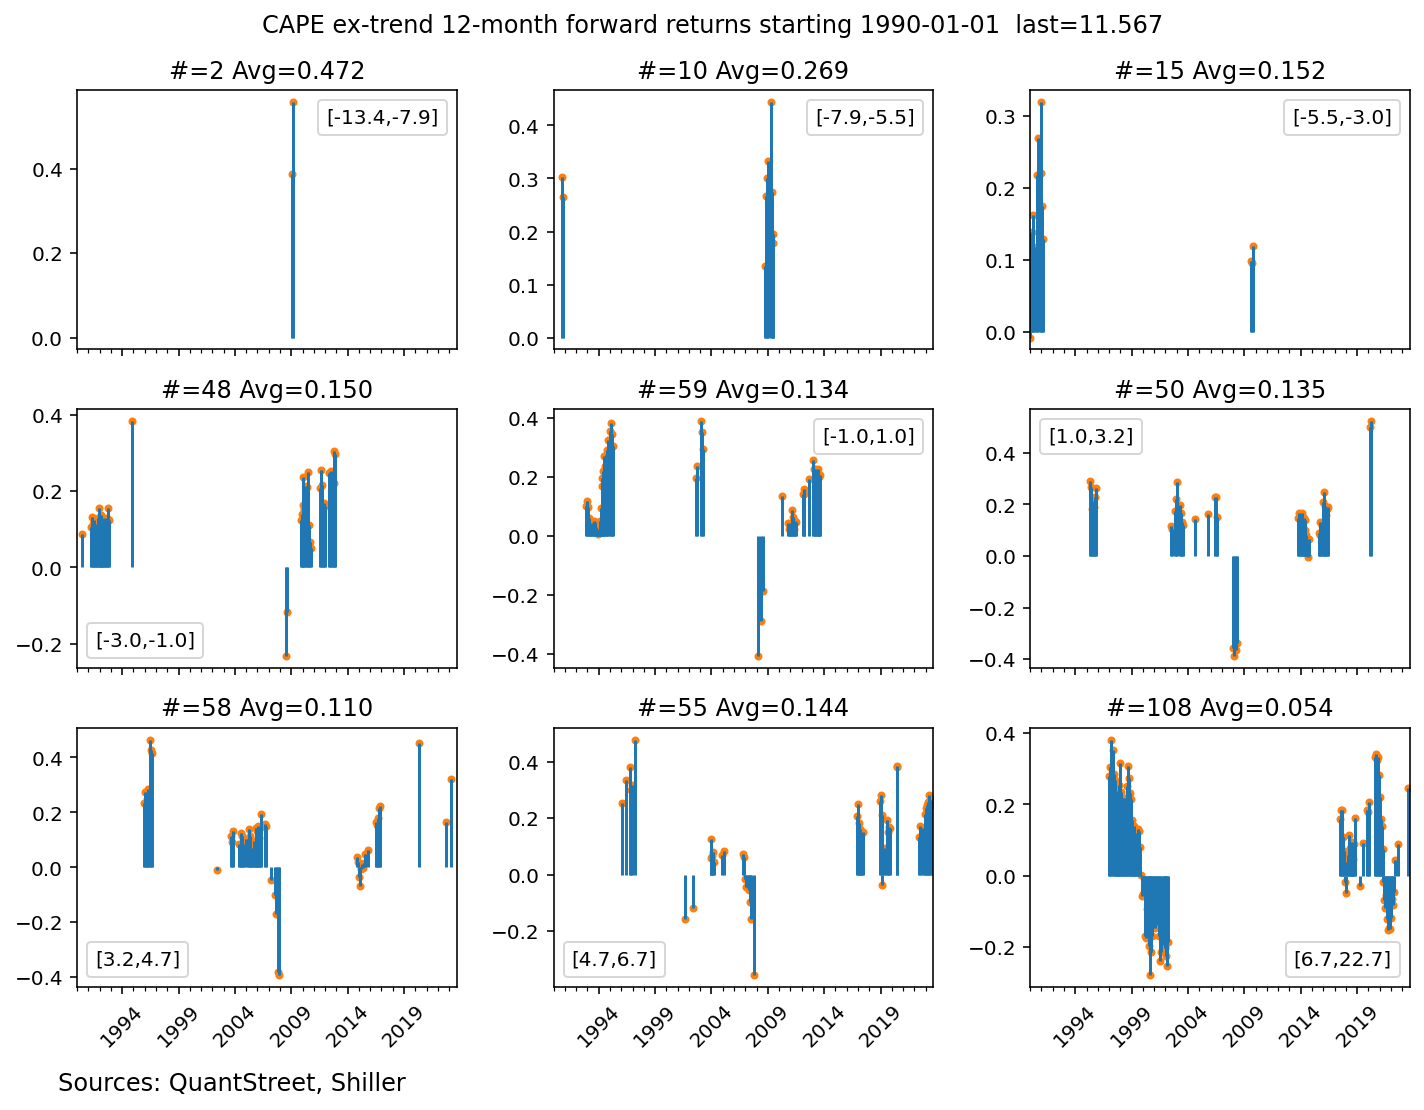
Since 2003, average year-ahead returns in the highest detrended CAPE valuation bucket are 7.7%, and they would be even higher if not for the 2020 market selloff associated with the onset of COVID. It is hard to argue that the COVID selloff was caused by high stock market valuations, rather than factors associated with the pandemic.
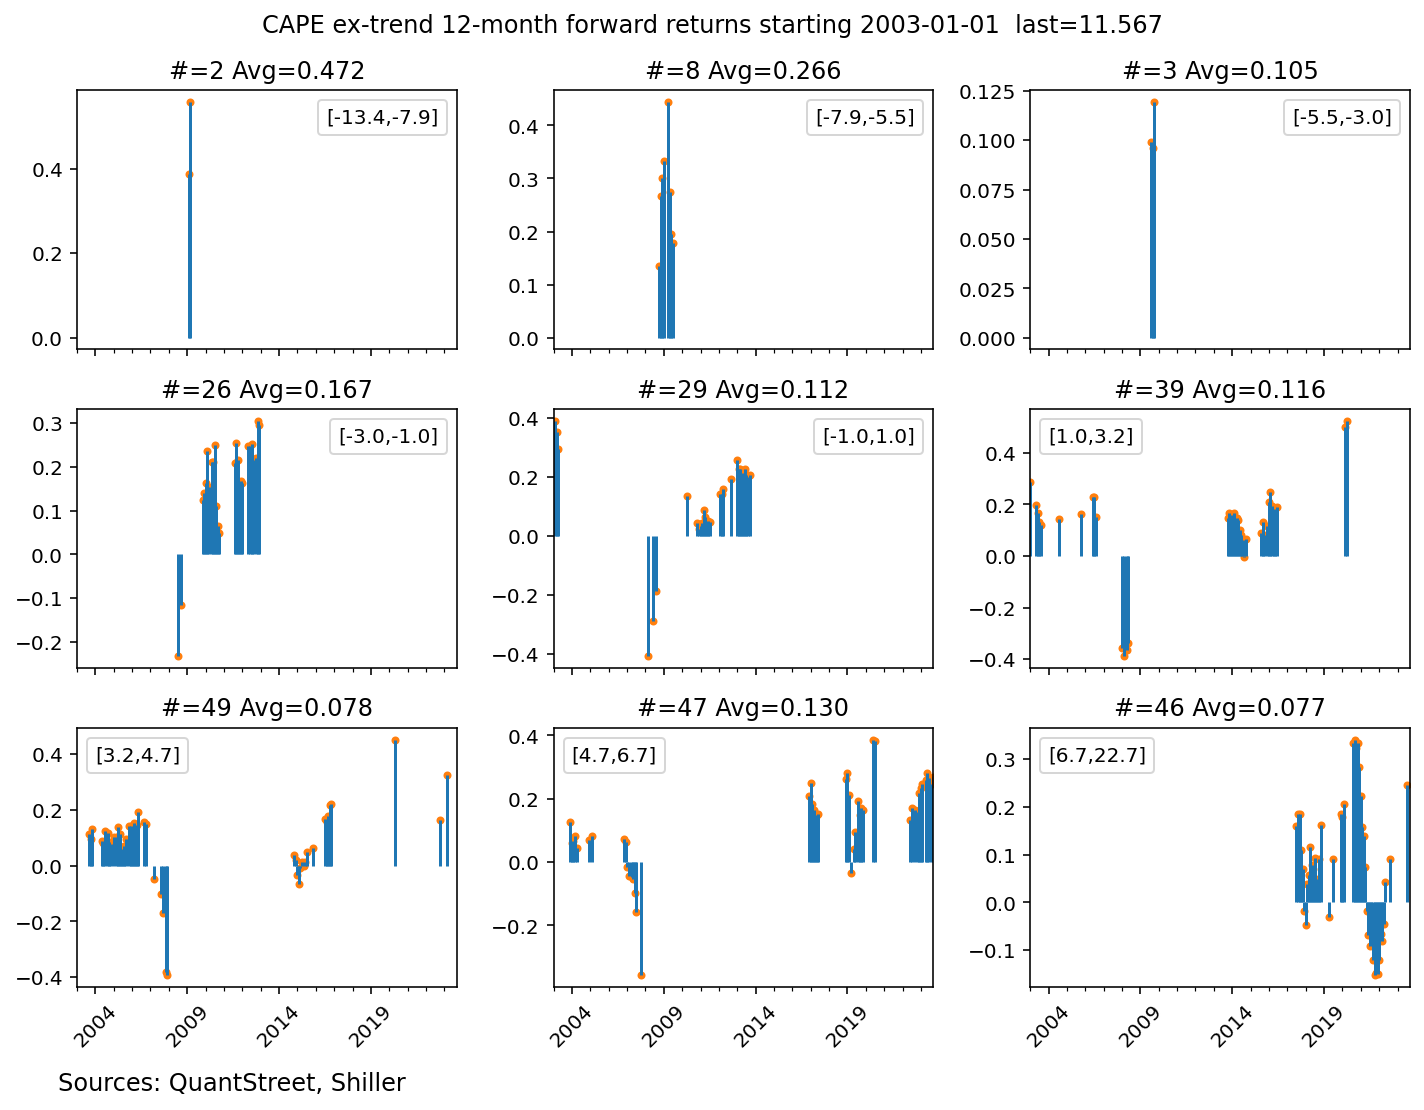
For those concerned that detrended CAPE is forward looking — since it uses the entire data sample to take out the time trend — the Appendix repeats the analysis using raw, non-detrended CAPE. The results from using raw CAPE are even more supportive of the thesis that high values of CAPE in the recent few decades had no bearing on future stock market returns.
Is the current market just like the late 1990s?
Repeating the above analysis using three-year forward returns and detrended CAPE since 1990 shows that the highest detrended CAPE bucket had an annualized three-year ahead return of 5.2%. Excluding the dot-com bubble would make the three-year ahead return in the highest (and current) detrended CAPE bucket look downright rosy. (Note that the global financial crisis selloff did not happen from highly elevated CAPE levels.) Concerns about current valuations therefore critically depend on whether now is just like the late 1990s.
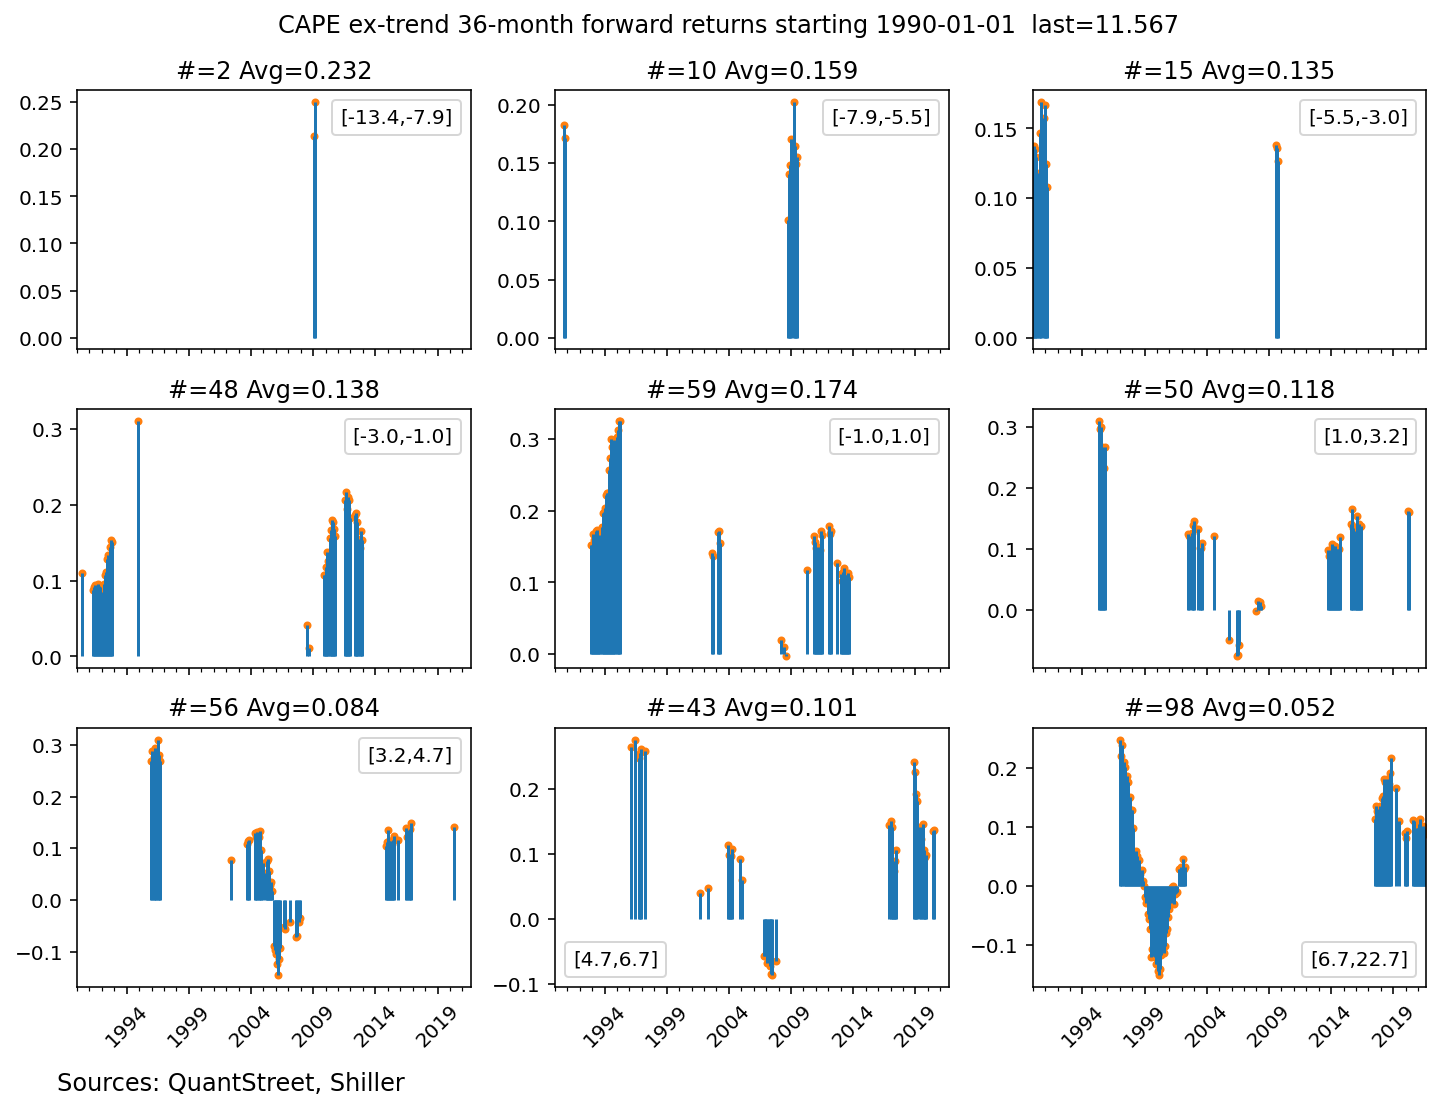
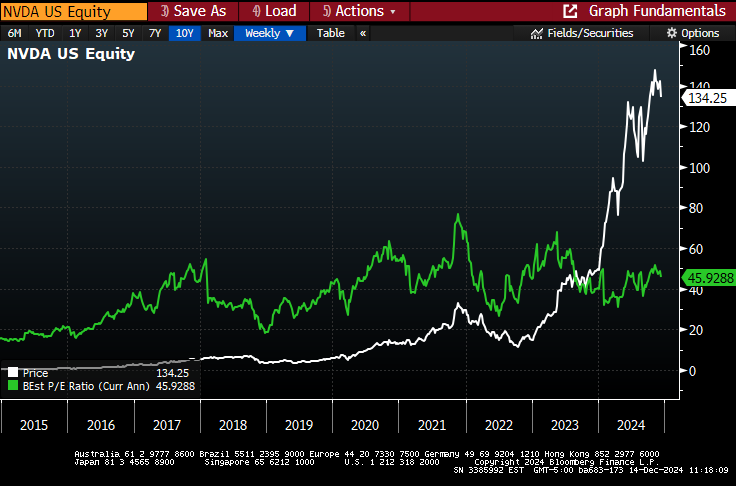
Current valuations are nowhere near as stretched as market valuations were in the late 1990s and our view is that current tech euphoria is much more grounded in earnings than the late-1990s market bubble. (Some market commentators agree with this, but others do not.) Taking Nvidia as a case in point, while its stock price is up massively over the last few years, its price to expected earnings is flat suggesting the entirety of the runup is due to investors’ upward reassessment of the company’s earnings.
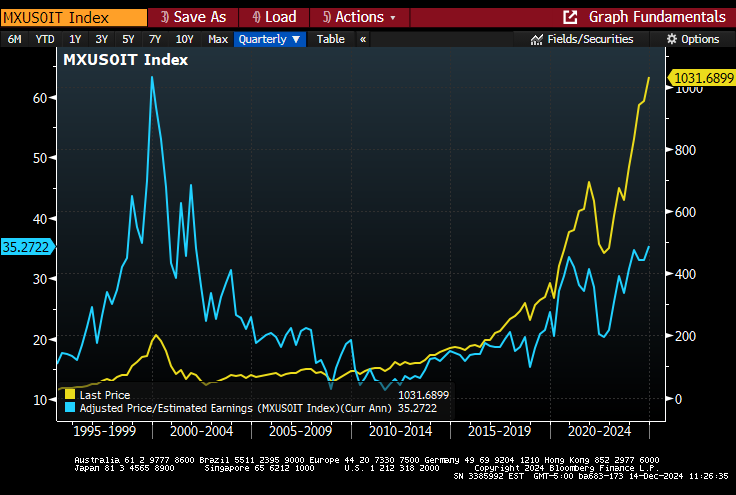
Another data point is the price-to-expected-earnings ratio for the broad technology sector using the MSCI USA Information Technology Index (the Nasdaq price-to-expected-earnings ratio doesn’t go back to the early 1990s). The recent sharp runup in technology stock prices has been supported by increasing earnings expectations. The price-to-expected-earnings ratio of the tech index hit a 63.5 multiple prior to the dot-com bubble crash, whereas today the index is trading at around 35 times forward earnings. While this is a historically high valuation multiple, it is nowhere near the market excesses of the dot-com bubble. The recent runup in prices has been much more fundamentally driven than the dot-com bubble market rally.
Takeaways
The market-is-overvalued argument is predicated almost entirely on the analogy of today to either the dot-com bubble or to the Great Depression. In both of those cases a high CAPE level was followed by a market selloff. But those are just two data points, and neither is particularly apropos to the state of markets today. Over the last 20 years — outside of the COVID selloff which was not driven by high valuations — there is not a strong relationship between CAPE and future returns.
It is, of course, impossible to know what the market has in store for investors in the coming months and years. But using CAPE would not have been an effective forecasting variable for market returns over the past 20 years. Perhaps CAPE will prove more prescient in the years ahead. Our bet is the next market selloff will happen for an as-of-yet unknown reason and the current high historical levels of detrended CAPE are not particularly worrisome based on the last several decades of data.
[1] We use nine CAPE buckets because 3×3 graphs use space more efficiently than 5×2 ones.
Appendix
The next table repeats the analysis from the main part of the article but using raw, not detrended, CAPE.
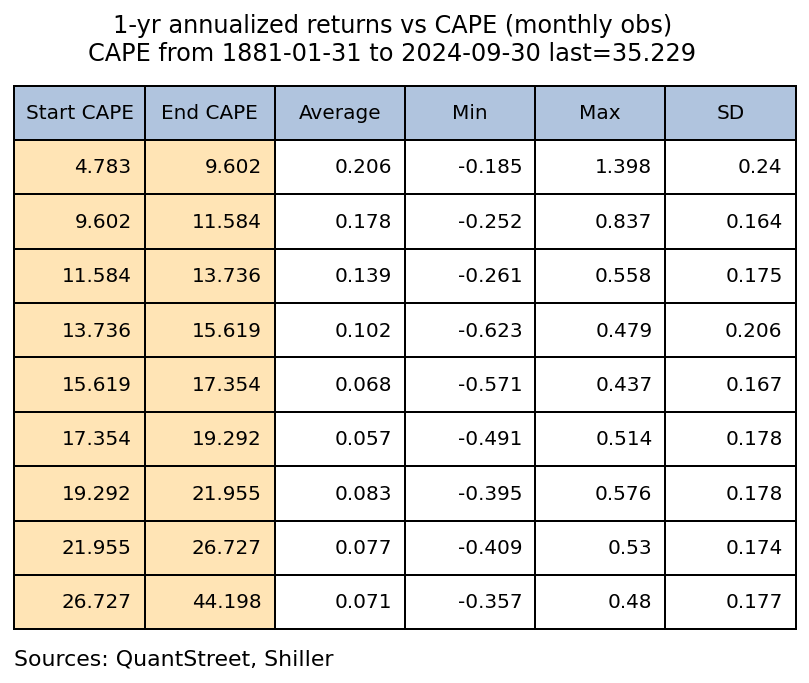
Since 2003, raw CAPE has spent the vast majority of its time in the upper tercile of its historical range. Either the market has been extraordinarily imprudent over the last 20 years, or the level of CAPE from 1890 may not have much to say about the current level of CAPE.
