2/2/2024 — The following analysis shows the performance of QuantStreet’s separately managed account strategies against benchmarks. The analysis starts on the launch date of each separately managed account strategy.
Strategy Summary
| QuantStreet Strategy | Start Date | Risk Level | Fee (bps) |
| Core | 12/1/2021 | 85/15 | 30 |
| Aggressive | 11/17/2022 | 95/5 | 30 |
| Balanced | 8/16/2023 | 60/40 | 30 |
All performance is shown after the above hypothetical fees have been deducted. Fees are shown in basis points. The 30 basis point fee used for the analysis represents an institutional-level fee. Fee levels vary across clients. Each strategy targets a risk level corresponding to the stock/bond mix shown in the Risk Level column. Each strategy can deviate from the targeted risk level at the discretion of QuantStreet.
Core Strategy
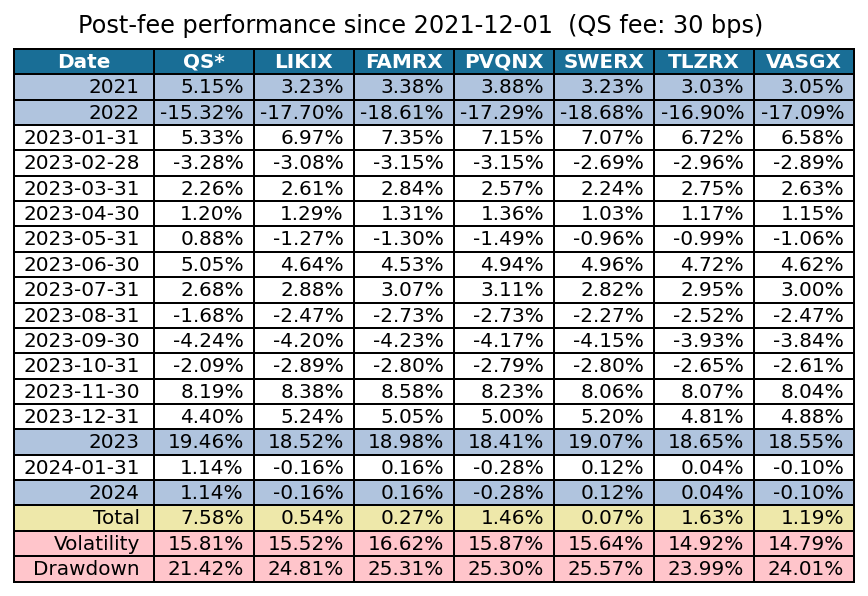
The QS* column shows the post-fee performance of QuantStreet’s strategy from the start date. The other columns correspond to the returns of other asset allocation mutual funds over the same time period.
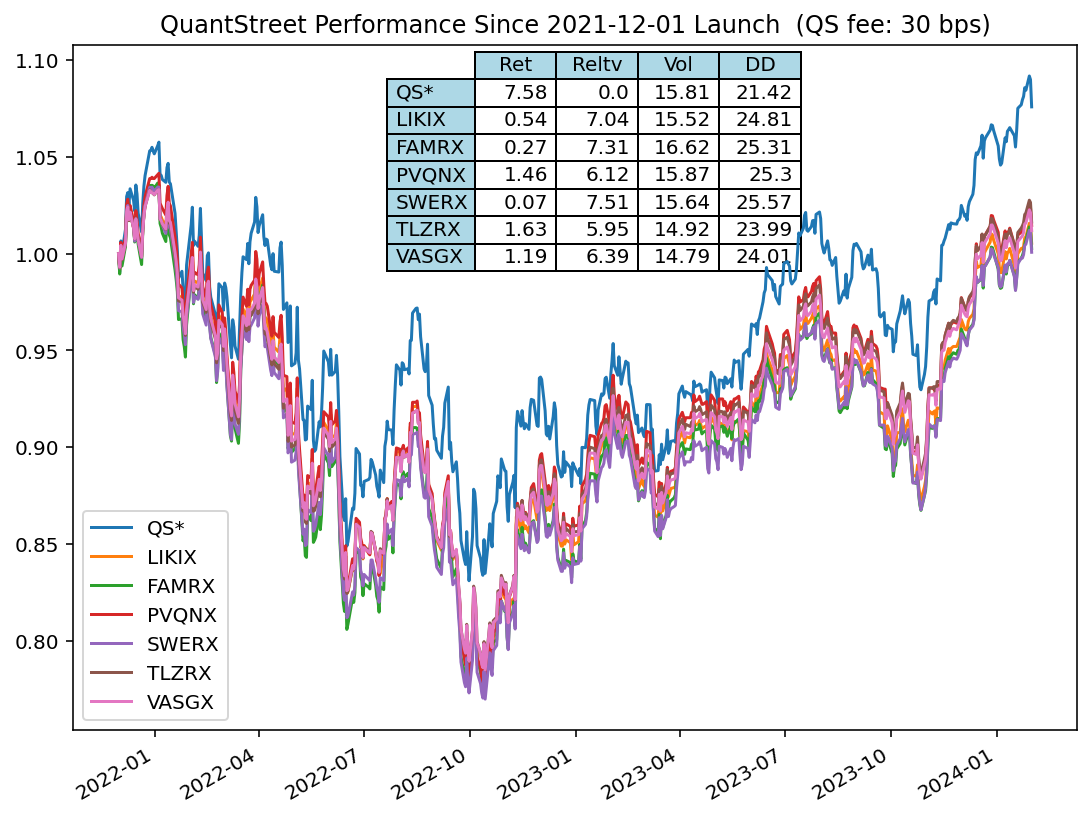
The figure shows the post-fee performance of QuantStreet’s strategy. The column labeled Reltv shows the QuantStreet strategy’s cumulative life-to-date performance minus the performance of the given benchmark.
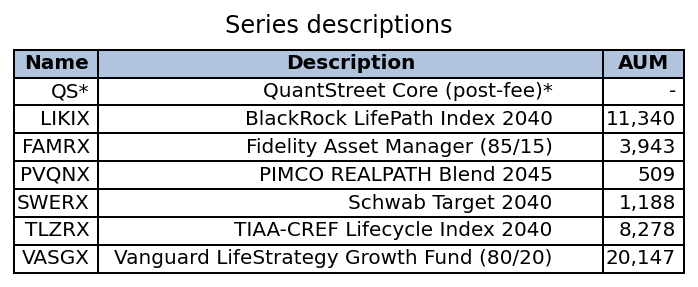
Names and assets under management (in millions) of benchmark funds.
Aggressive Strategy

The QS* column shows the post-fee performance of QuantStreet’s strategy from the start date. The other columns correspond to the returns of other asset allocation mutual funds over the same time period.

The figure shows the post-fee performance of QuantStreet’s strategy. The column labeled Reltv shows the QuantStreet strategy’s cumulative life-to-date performance minus the performance of the given benchmark.
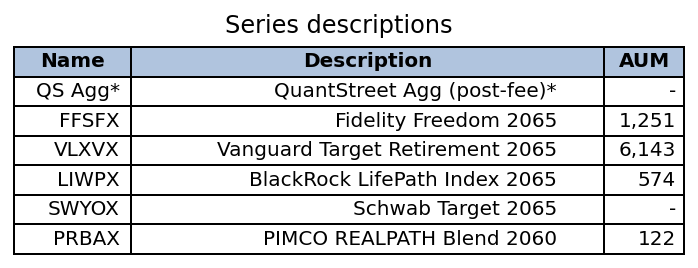
Names and assets under management (in millions) of benchmark funds.
Balanced Strategy

The QS* column shows the post-fee performance of QuantStreet’s strategy from the start date. The other columns correspond to the returns of other asset allocation mutual funds over the same time period.
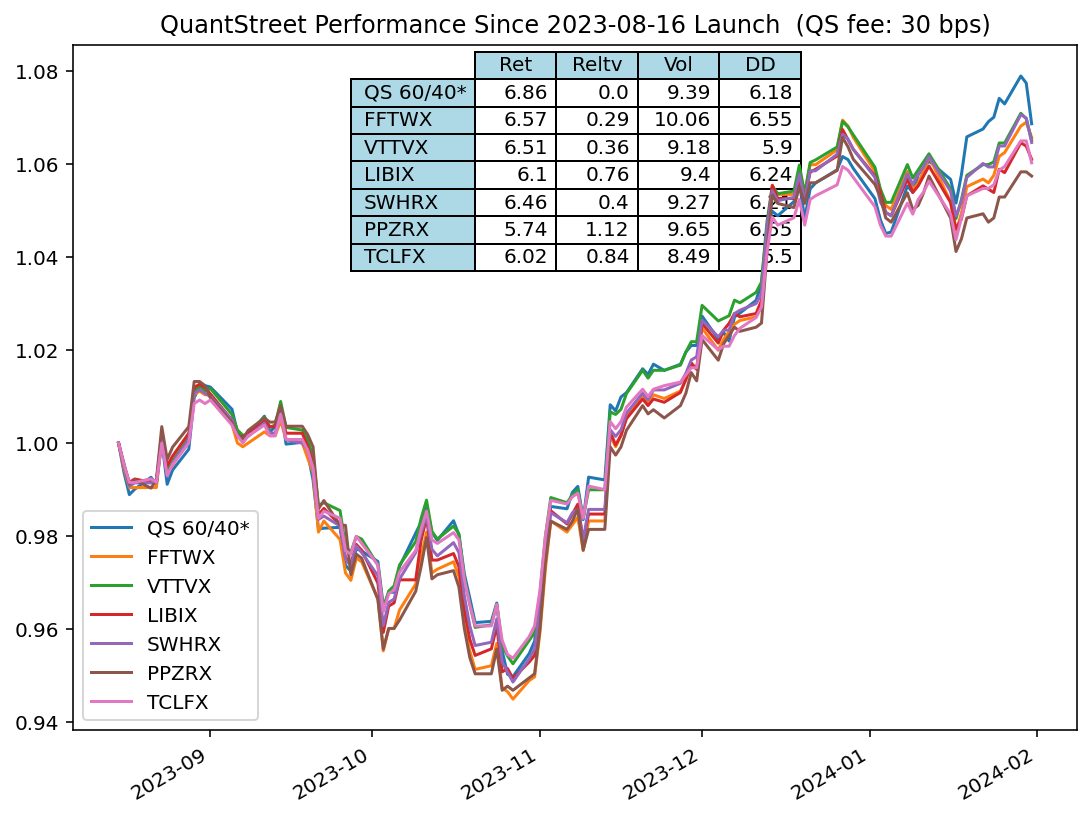
The figure shows the post-fee performance of QuantStreet’s strategy. The column labeled Reltv shows the QuantStreet strategy’s cumulative life-to-date performance minus the performance of the given benchmark.

Names and assets under management (in millions) of benchmark funds.