February 12, 2026 —
Target date funds manage more than $4 trillion of assets. Their portfolios must be very thoughtful. A methodology to extract their portfolio allocations provides important insights for investors.
The problem
When we launched QuantStreet back in 2021, our belief was there was a demand in the market for thoughtful, rigorous, quantitatively-driven tactical asset allocation strategies. A major early challenge was how to measure the performance of our tactical strategies. The answer seemed to be target-date funds (TDFs). Like us, TDFs have a mandate to do asset allocation, across stocks and bonds, in the US and internationally. Plus, TDFs are huge, managing trillions of dollars (over $4 trillion according to the Investment Company Institute) on behalf of US investors.
Given their size and importance to the financial system, it would stand to reason that target date funds represent their parent companies’ careful thinking about how to invest on their clients’ behalf. TDF portfolios are thus a natural benchmark for asset allocation strategies.
Our first three tactical strategies at QuantStreet were 60/40 (stock/Treasury bond), 85/15, and 95/5 portfolios (we now are running strategies at more risk levels, like 70/30, 80/20, and 100/0, i.e., all-stock level risk). For each risk level, we identified several target date funds that, in the year prior to our initial analysis, had risk levels similar to our strategies. These TDFs provided a good benchmark for our strategies for a while, but a few problems emerged:
1. Over time, as target date funds draw closer to their vintage date, they decrease their risk levels. For example, several TDFs which were initial benchmarks for our 60/40 strategy are starting to run at lower risk levels and may soon cease to be appropriate benchmarks.
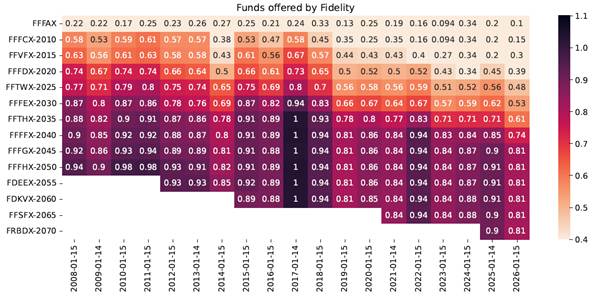
The above chart shows the risk level of different target date funds offered by Fidelity over time. Each cell represents the stock weight of each TDF in each year of the sample (e.g., 0.40 means the fund ran at the 40/60 stock/Treasury bond risk level in a given year). Notice how the earlier vintage funds, e.g., 2020, 2025, etc., have declining risk levels over time. This happens because funds reduce their risk exposures as their investors approach retirement.
2. Having multiple (four to seven) different target date benchmarks for our strategies is inelegant. It is simpler to have a single benchmark. The issue with having a single benchmark is that, for many of our tactical strategies, no non-TDF benchmark exists. And because of point 1 above, the set of appropriate TDF benchmarks for a given tactical risk level strategy changes over time.
3. While an evolving set of TDFs does provide a natural benchmark for our strategies, knowing the names of the TDFs alone does not tell us anything about their asset class exposures. Are the TDFs all in US or international assets? How do they allocate their fixed income portfolios? Do they hedge inflation? To answer these questions, we have to consult the individual filings of each target date fund, which becomes unwieldy.
4. Another problem, related to the above point on explainability, is to measure how far our tactical strategies deviate from their TDF benchmarks. When investing, it is always a good idea to understand what is “neutral” and be able to determine how far away from neutral the portfolio currently stands. Target date funds provide a natural “neutral” portfolio against which to benchmark.
The solution
To solve the above issues, we introduce a new procedure for extracting asset allocation portfolios from target date funds so that the asset allocation portfolios have stable risk levels over time and are interpretable. Here are the highlights:
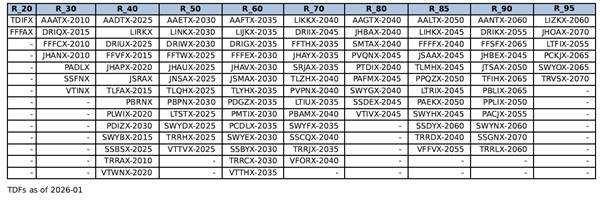
1. First, in each year of our sample (so going back to our first strategy launch on December 1, 2021), we identify those target date funds which fall into the risk bucket associated with each of our tactical strategies, e.g., 60/40, 70/30, and so on. Because TDFs change their risk exposures over time, the set of TDFs falling into each risk bucket also changes over time. The most recent funds in each of our risk buckets are:
2. In each year of our analysis, we form an equal-weighted index consisting of all the TDFs in each risk bucket. We then run a constrained regression of the daily returns of this index on a set of low-cost, liquid exchange traded funds (ETFs), which represent the assets that the TDFs likely invest in. The constrained part means that the weights the regression returns for each ETF in the replicating portfolio must be non-negative and all the weights must add up to one. The current set of replicating portfolios are:
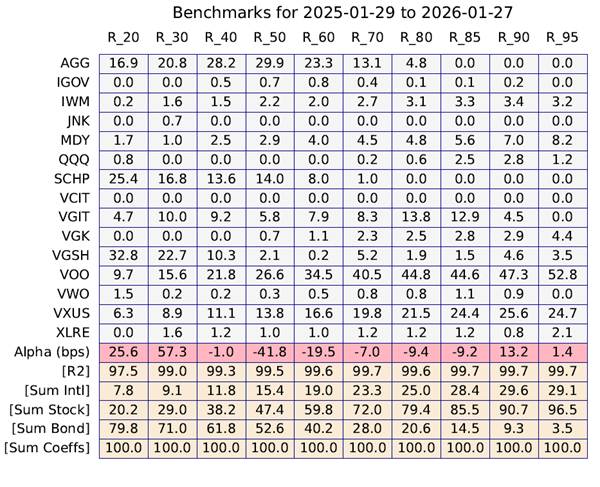
This table is a lot to take in, so let’s go through it. Each column corresponds to the ETF replicating portfolio for a given risk bucket. For example, the 85/15 column (labeled R_85) shows the ETF replicating portfolio that runs at the same risk level as our 85/15 tactical risk strategy, i.e., 85% stock and 15% Treasury bond risk. This portfolio has 3.3% allocated to small caps (IWM), 5.6% to midcaps (MDY), 12.9% to intermediate-duration Treasuries (VGIT), 24.4% to international non-US stocks (VXUS), and so on.
The row labeled R2 shows the R-squared from the above constrained regression. The 99.7% means that the above replicating portfolio captures 99.7% of the risk of the underlying TDF index over the prior year. This represents a very close replication of the underlying portfolio. It is important to keep in mind that a replicating portfolio which had a good fit for TDF returns in the prior year, may have a worse fit for TDF returns in the future.
The Sum Intl row tells us how much of the portfolio is allocated internationally (28.4%), the Sum Stock row tells us the portfolio has 85.5% of its weight allocated to stocks, and the Sum Coeffs row just checks that all the weights add up to 100%, as they should. Again, these estimates are backward looking, and may not properly reflect the future exposure of target date fund portfolios.
The takeaways
There are numerous takeaways from the above analysis. First, we can provide clients with a dynamic performance benchmark to, say, our 85/15 strategy which contains, in every year, exactly the TDFs that run at the 85/15 risk level. The same is true for our tactical strategies at other risk levels. The new performance charts are clearer and easier to interpret than their predecessors. The downside of the new analysis is that it relies on the hypothetical performance of the TDF replicating portfolios, and so may not be an appropriate tool for all investors. If you would like to see these performance charts, please reach out. [1]
As importantly, the portfolios shown in the table above cut through the idiosyncratic noise of any one target date fund, to distill the essence of TDF allocations across all of Wall Street. The portfolios consist of low-cost, liquid ETFs and are readily interpretable—e.g., how much international, how much in Treasury Inflation Protected Securities (SCHP), and so on—and readily tradable. The downside is that replicating portfolios are unlikely to beat the best performing TDF in any risk bucket-year combination because they attempt to capture the performance of the average fund, not predict which will be the best fund.
QuantStreet clients who would like to invest at a given risk level now have two options: (1) the tactical machine-learning-based portfolios we’ve been running since inception, or (2) a portfolio consisting of low-cost, liquid ETFs that tracks the average target date fund at each risk level.
An important caveat applies: the tracking offered by our ETF replicating portfolios is not perfect, and there is no guarantee that ETF replicating portfolios estimated in the prior year, will do a good job proxying for the returns of target date funds in the future.
For more details, please reach out to obtain a copy of our white paper on the matter.
Getting more information
If the above is of interest to you, and you would like to learn whether investing in a target date fund replicating portfolio at your desired risk level is a good fit, please reach out. If you are an investment advisor yourself and would like to discuss how to access our ETF replicating portfolios on a monthly basis, please reach out as well. Of course, if you are interested in our tactical portfolios, we’d love to hear from you too.
[1] Per the Investment Adviser Marketing Rule, we will verify that the hypothetical performance charts are relevant to your financial situation and investment objectives before sharing them.
Working with QuantStreet
QuantStreet is a registered investment advisor. It offers financial planning, separately managed accounts, model portfolios and portfolio analytics, as well as consulting services. The firm’s approach is systematic, data-driven, and shaped by years of investing experience. To work with or learn more about QuantStreet, contact us at hello@quantstreetcapital.com or sign up for our email list.