April 5, 2026 —
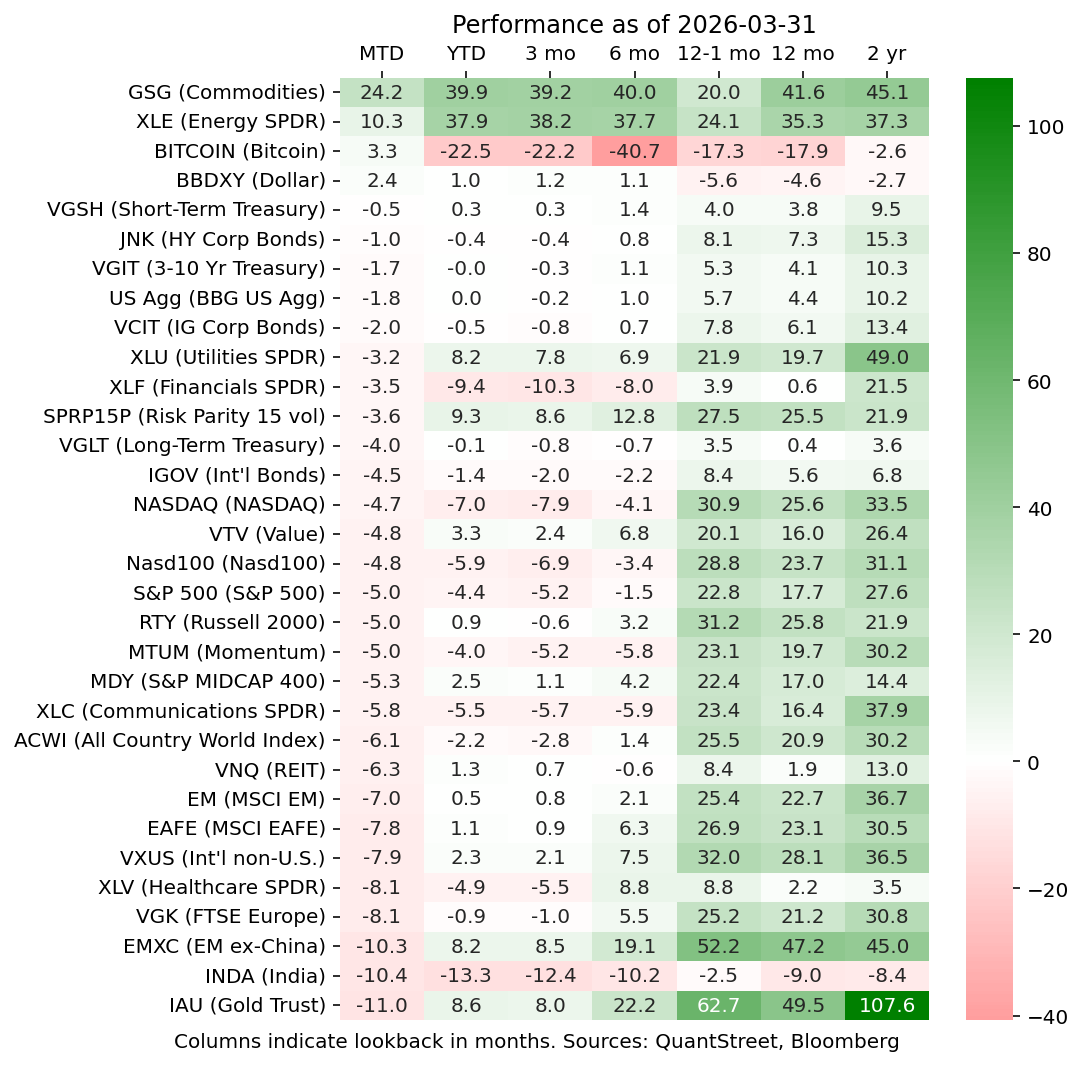
March 2026 was a rough month for financial markets. Broad indexes experienced large selloffs, led by international stocks, though many of these still remain up in 2026. The dollar rallied strongly, breaking its year-plus downtrend. Energy was the big winner in March, with a broad commodities basket up over 24% (energy prices did even better) and energy stocks up over 10%. Bitcoin eked out a small gain, while gold got crushed, coming in as the worst performing asset class in the month. Anecdotally, one of the reasons for the gold selloff was forced deleveraging, as investors needed to raise cash and did so in an asset class in which most are sitting on large gains. As the markets did overall, QuantStreet was down in March. You can see our performance statistics for more information.
Our general portfolio positioning is to maintain targeted risk levels, with a diversified portfolio between US and international assets. Our international allocation rests largely on the thesis of a weaker dollar, which we laid out in an article two months ago. To summarize: the dollar is overvalued based on a real-exchange rate basis and both President Trump and China’s Xi Jinping want a weaker dollar. Our view on US stocks is bullish because we are in the early innings of a massive AI-related infrastructure build out, coming at a time of low corporate leverage and lots of credit capacity in the banking system. Furthermore, there is fiscal stimulus in the pipeline from the One Big Beautiful Bill Act and an impending M&A cycle. The Kevin Warsh Fed is likely to be overly stimulative, which is not great in the long-run, but positive for financial markets in the short-term. Nevertheless, the weak dollar tailwind to international assets warrants their inclusion in our portfolios.
Of course, should the energy spike from the Iran War prove more severe than is currently anticipated, the bull case may need to be reexamined. Our view (see below), is that the energy price spike is unlikely to disrupt the bull market, though it is certainly a tail risk.
Private markets
While only tangentially related to the Iran War, very negative news flow in the private credit space continued as investor requests for the return of their capital hit the liquidity barriers of interval funds. Investors pulling funds and negative press coverage (for example, about exposure to the ailing software industry) represent a negative feedback loop, which may yet persist for some time, despite the industry’s claims that their portfolios are in good shape. Goldman Sachs, for one, agrees with the benign private credit thesis, while others, for example, PIMCO, are less sanguine. The scope of the problem is big, though likely manageable: $500 billion of business development company (BDC) loans and $3.5 trillion of private credit loans overall, according to Reuters.
Our own view is that the sector is starting to look interesting, especially the publicly traded stuff that has sold off a lot recently. The next chart shows the inverse BIZD ETF price superimposed on the spread of high-yield bonds. BIZD is a large, liquid ETF which owns a portfolio of publicly traded BDCs. Its stock price, which usually tracks (inversely) the level of high-yield spreads, has meaningfully underperformed in the last year or so. Plus the ETF’s dividend yield is in the double digits.
Despite this, our preference is to sit on the sidelines and watch the space—one of our agentic AIs now sends us daily emails about goings on in private markets—until the tide of negativity begins to turn (which might be following an as-yet-unforeseen blow-up event). In particular, our allocation model doesn’t yet like publicly traded BDCs largely because of the terrible price trend. Should the trend begin to turn, while we will miss part of the upside, we will likely allocate to the sector when it’s no longer a “falling knife.”
Energy markets
We recently wrote on QuantStreet’s Substack about our views on the Iran War energy price spike. To summarize, not all historical energy price spikes are bad for stock prices, especially the ones that are demand driven and short. While the present price spike is the bad kind, i.e., supply driven, the market believes it will be short-lived based on the steep backwardation seen in the oil futures market (next figure). Our own view, based on a read of recent news flow, is that the market is correct. Indeed, for the reasons discussed in the Substack piece, we think that the impact of the Iran War on broader financial markets will be temporary, though certainly tail risks abound.
At QuantStreet, we have always been proponents of a systematic analysis of financial markets and the macroeconomy. Towards this end we built a neural network model to help us identify times that large market selloffs are particularly likely. At the present, despite the large spike in the price of oil, which is one the inputs into our forecasting model, the model predicts an almost zero probability of a 20% or higher selloff over the next year.
(Full disclosure. The model was also very sanguine ahead of last year’s nearly 20% market selloff on the back of the Trump administration’s tariffs announcements in March and April of 2025. However, the model’s lack of concern also gave us confidence to stay with our risk exposures during the depth of last year’s market selloff. The model could also be wrong this time around.)
Interestingly, the large selloff model allows us to war game possible scenarios and see how they impact the probability of a large market selloff. The figure below shows the increase in the probability of a 20% or larger selloff over the next year as a function of the change in the price of a barrel of West Texas Intermediate (WTI). The blue and orange lines show the increase in large selloff probabilities from two different models. The dashed, red vertical line shows the most recent year-over-year increase in the WTI price using month-end data.
Despite the recent increase in the price of WTI, its March 2025 to March 2026 change is only in the mid-30% range. At this level of price increase, the large selloff model does not see an increase in the probability of a large selloff. However, should the WTI price increase continue into the 150% or higher year-over-year range, the probability of a large selloff starts increasing meaningfully. However, we and (more importantly) the oil futures market think this is unlikely.
Working with QuantStreet
QuantStreet offers financial planning, wealth management, model portfolios, portfolio analytics, and a platform for advisors looking to gain independence. The firm’s investment approach is systematic, data-driven, and shaped by years of investing experience. To work with or learn more about QuantStreet, join our mailing list or contact us at hello@quantstreetcapital.com. Also, please sign up for our Substack.
QuantStreet is a registered investment advisor. Registration does not imply a certain level of skill or training. All financial forecasts are fraught with risk and uncertainty. Our views may prove incorrect and market outcomes may be materially worse than we anticipate. Please see our full disclosure about the limitations of forward-looking statements and the risks of investing at https://quantstreetcapital.com/blog_disclosure/.